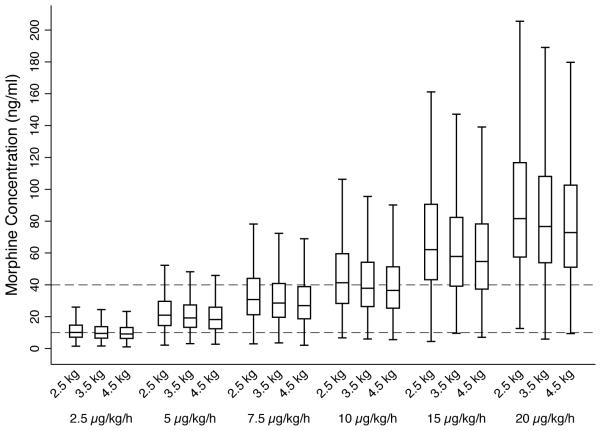
Figure 4.
Predicted morphine concentrations at different continuous morphine infusion rates by birthweight. Each boxplot represents steady-state concentrations from 1000 simulated neonates with HIE receiving hypothermia. Outliers are not presented. Dashed lines reference target concentrations between 10 to 40 ng/ml.

