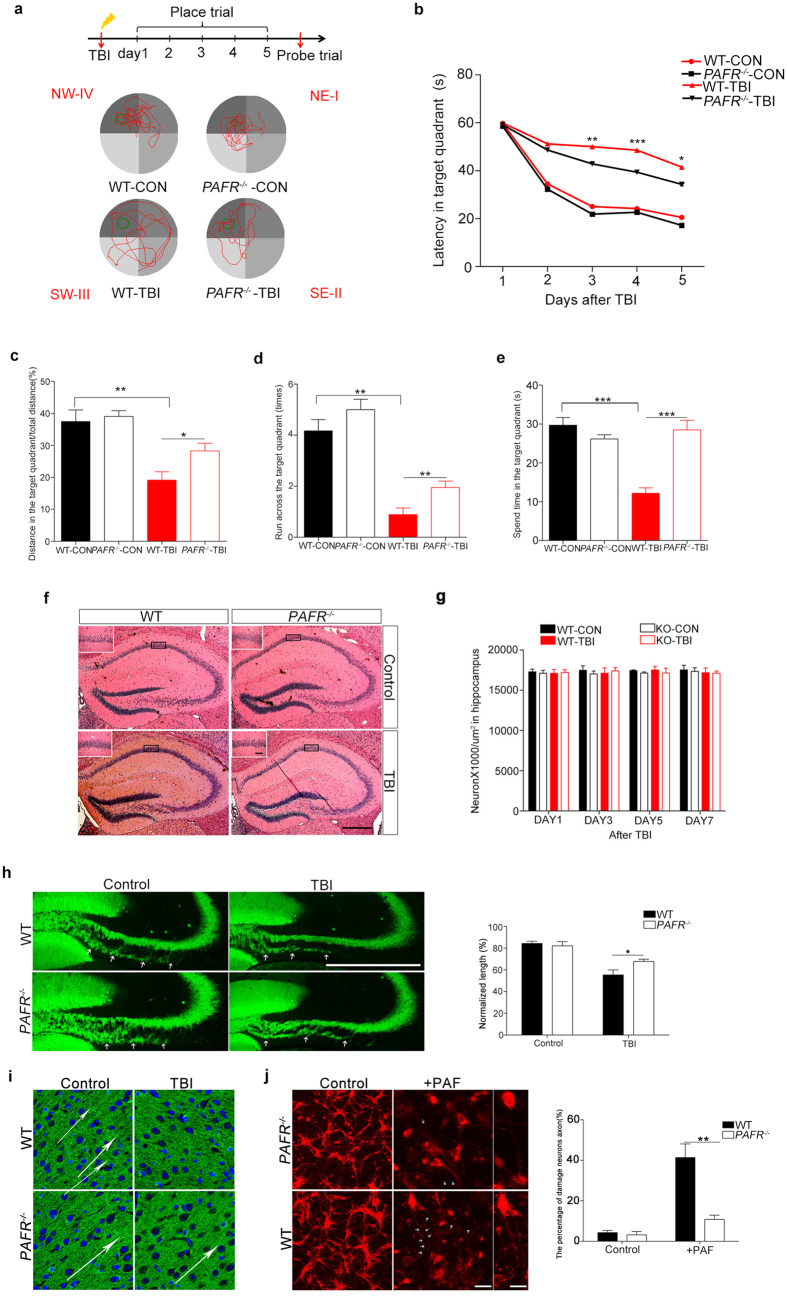
Figure 2. Effects of PAF-R KO on MWM performance in PAFR−/− mice.
(a) MWM experimental flow chart and representative images of the path chart of each experimental group in the MWM. WT mice spent significantly more time in the target quadrant trajectory than PAFR−/− mice (n = 8). (b) The escape latency of the WT-TBI group was significantly longer than that of the PAFR−/−-TBI group. Both PAFR−/−-TBI and PAFR−/−-CON mice had significantly decreased escape latency times compared to their WT counterparts at day 3, 4 and 5, respectively. (c) Distances swam in the target quadrant in the probe trial were significantly shorter for WT-TBI mice than for PAFR−/−-TBI and WT-CON groups, respectively. (d) The number of platform crossings in the probe trail increased significantly in the PAFR−/−-TBI group compared with the WT-TBI group. (e) Signifciant differences were found among the PAFR−/−-TBI group and WT-TBI group in the time spent in the target quadrant during the probe trial. *P < 0.05, **P < 0.01, ***P < 0.001, one-way ANOVA. (f) Sections of hippocampal tissue from each experimental group stained with hematoxylin eosin stain showed no morphological differences between the groups. Scal bar, 500 μm. (g) Quantification of neurons at wild type and PAFR−/− mice in hippocampus after TBI. n values of mice are indicated no difference. (h,i) Comparison of axonal length projected from DG of hippocampus and the direction of the axon in cortex between wild type and PAFR−/− mice, the difference between WT-TBI and PAFR−/−-TBI mice is statistically significant. (n = 6) (j) Comparison of axonal fracture between wild type and PAFR−/− primary neurons, the difference between WT and PAFR−/− primary neurons after using PAF is statistically significant. *P < 0.05, **P < 0.01, ***P < 0.001. One-way ANOVA. Scale bars, 100 μm, 50 μm.

