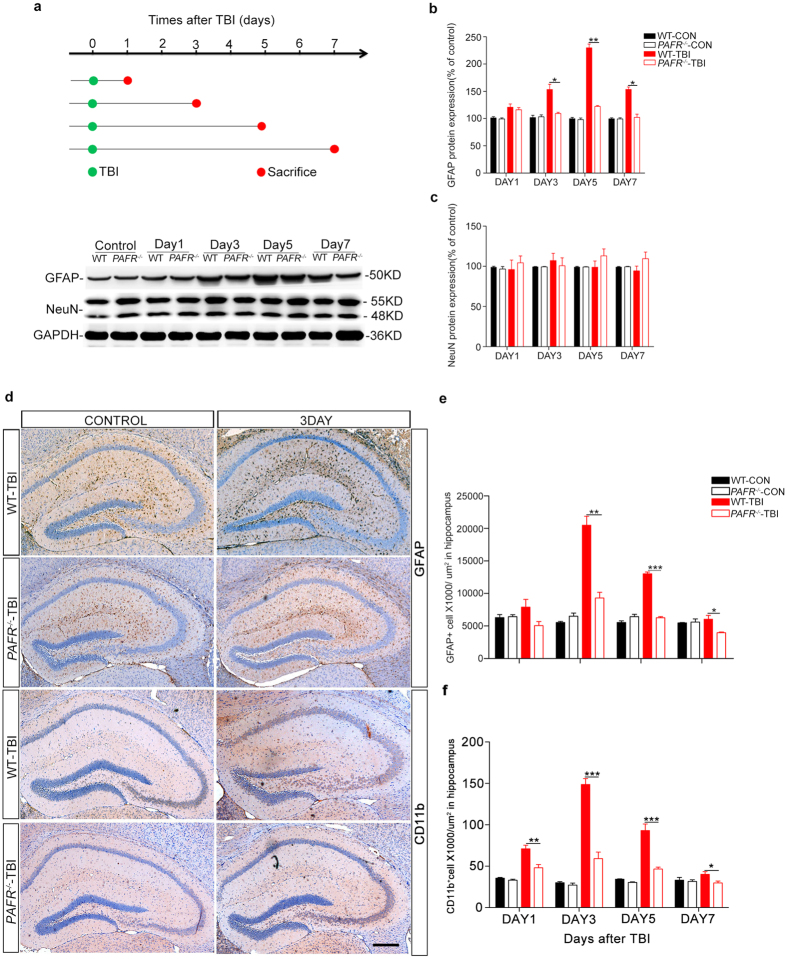
Figure 3. PAFR−/− mice have reduced numbers of activated astrocytes and microglia after TBI.
(a) Flow sheet for the TBI model and sample collections. At days 1, 3, 5, and 7, respectively, mice were sacrificed and brains collected for western blot and immunohistochemistry analyses. Representative images showing GFAP and NeuN proteins expression after TBI in a time-dependent manner. (b) GFAP/GAPDH bar graph, representing the percentage ratio of GFAP to GAPDH in PAFR−/−-TBI and WT-TBI mice at the above time points, respectively. (n = 6) (c) NeuN/GAPDH bar graph representing the percentage ratio of NeuN to GAPDH in PAFR−/−-TBI and WT-TBI mice at the above time points, respectively. (n = 6) (d) Representative immunohistochemical images of GFAP-positive astrocytes and CD11b-positive microglia in hippocampal sections after TBI at day 1, 3, 5 and 7, respectively. (e,f) GFAP and CD11b-positive cells counts in every μm2 in hippocampal sections (n ≥ 6 in the WT-TBI and control group; n ≥ 8 in PAFR−/−-TBI group). Scale bar, 500 μm. *P < 0.05, **P < 0.01, ***P < 0.001. One-way ANOVA.

