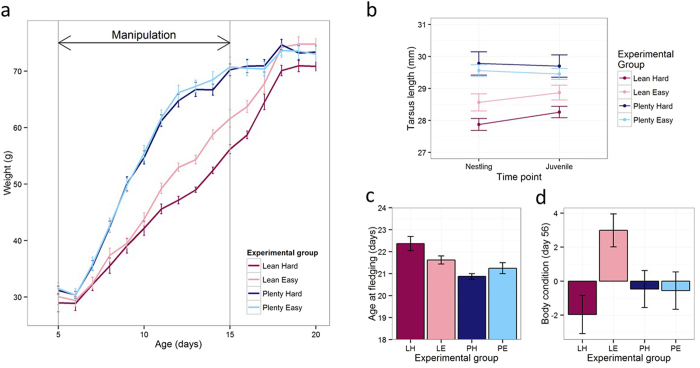
Figure 1. Effects of experimental treatments on development.
Error bars represent one standard error. (a) Mean daily weight by experimental group during and immediately after the manipulation. (b) Mean tarsus length by experimental group as nestlings (day 15) and juveniles (day 56). (c) Mean age at fledging in days by experimental group. (d) Body condition (residual of weight from skeletal size) by experimental group as juveniles (day 56).

