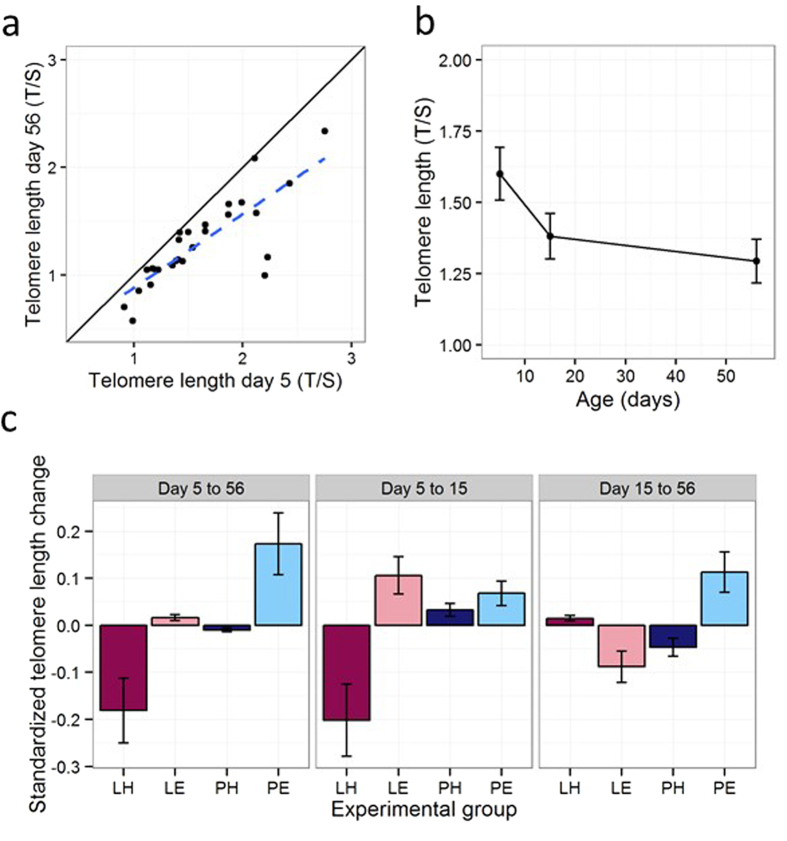
Figure 2. Telomere dynamics.
(a) Relationship between juvenile telomere length (day 56) and telomere length at day 5. The solid line represents x = y. If there were no overall attrition, observations would be expected to fall around this line. The dashed line represents the least-squares line through the data. (b) Mean telomere lengths at days 5, 15 and 56. Error bars represent one between-bird standard error. (c) Standardized change in telomere length (D) by experimental group over the whole developmental period (days 5 to 56), the period of the experimental manipulation (days 5 to 15), and the post-manipulation period (days 15 to 56). Error bars represent one standard error.

