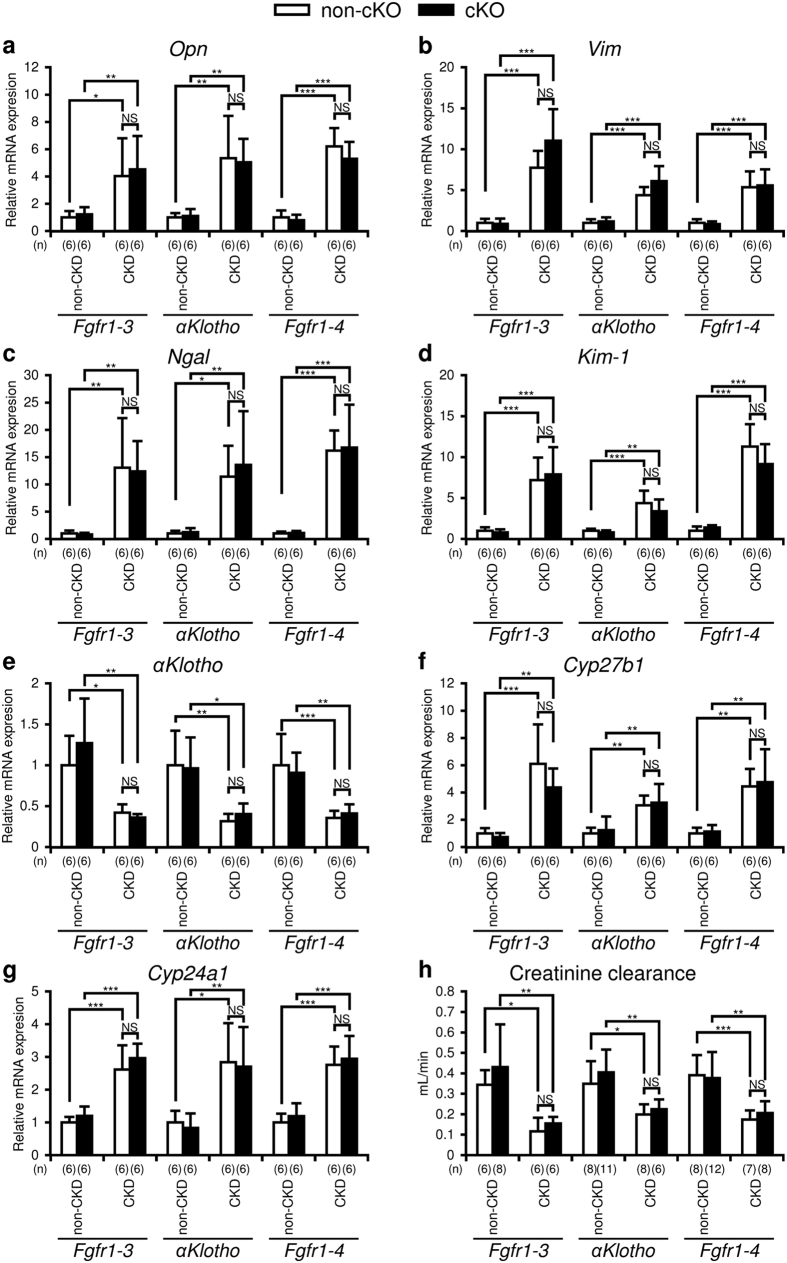
Figure 2. Markers for chronic kidney disease (CKD).
Quantitative RT-PCR using kidney RNA to analyse the mRNA levels of osteopontin (Opn) (a), vimentin (Vim) (b), neutrophil gelatinase-associated lipocalin (Ngal) (c), kidney injury molecule 1 (Kim-1) (d), αKlotho (e), Cyp27b1 (f), and Cyp24a1 (g) was carried out as described in the Methods section in mice with or without treatment (heminephrectomy plus high-phosphate diet) for CKD, and with (black bar) or without (white bar) parathyroid-specific genetic cKO of Fgfr1–3, αKlotho, or Fgfr1–4. Creatinine clearance (h) was also analysed as described in the Methods section. Values are expressed as mean ± s.d. n = 6 per group for panels a–g, and n = 6–12 for panel h; *P < 0.05, **P < 0.01, ***P < 0.001. NS, not significantly different (P > 0.05).

