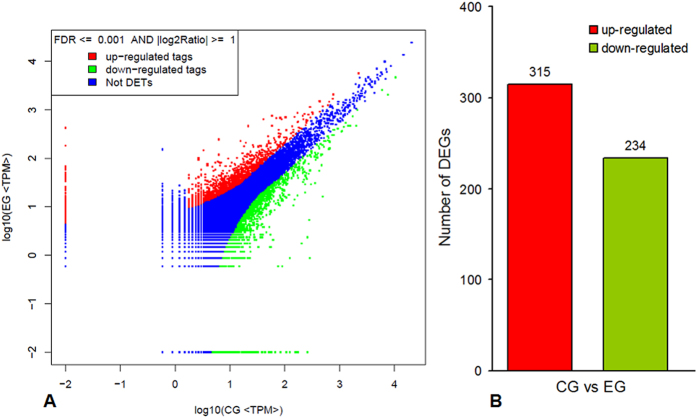
Figure 4. Summary of differentially expressed genes in pairwise comparisons between the mock-challenged control group (CG) and the A. hydrophila- challenged experimental group (EG).
(A) The differential expression analyses of tags by DGE, in which ‘Not DETs’ indicates ‘not detected expression tags’. Limitations are based on FDR ≤ 0.001 and the absolute value of Log2 (EG/CG) being greater than 1. (B) The number of differentially expressed genes (CG vs EG).

