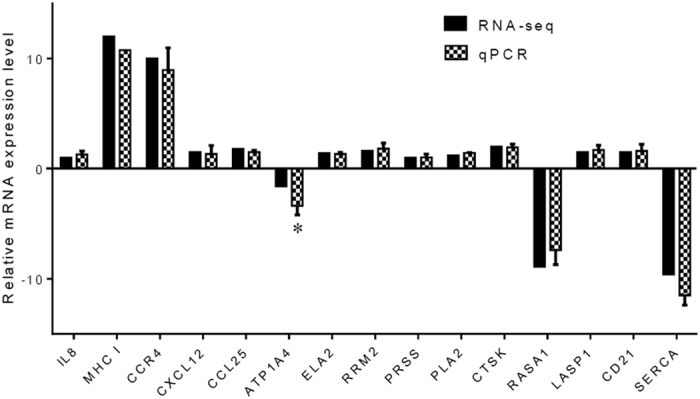
Figure 6. Validation of RNA-seq data by qPCR.

To validate the RNA-seq data, the relative mRNA levels of 15 randomly selected DEGs in the intestine of A. hydrophila-infected grass carp were examined by qPCR. The mRNA levels by qPCR are presented as the fold change compared with the mock-treated control after normalization against β-actin. The relative expression levels from the RNA-seq analysis were calculated as RPKM values. The asterisk (*) denotes the presence of a statistically significant difference (p < 0.05) in mRNA levels between the RNA-seq and qPCR analysis.
