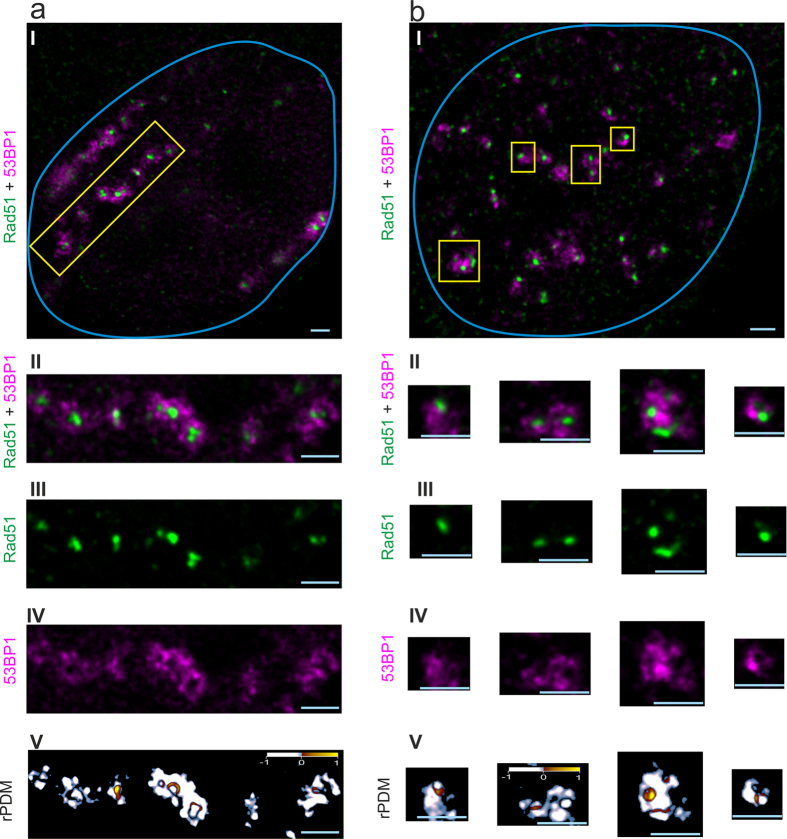
Figure 2. Nanoscopic images of 53BP1 and Rad51 IRIF.
In (a), a HeLa cell nucleus (blue line), which was hit by 3 Carbon ions and in (b) a nucleus hit by around 200 protons are displayed. 53BP1 (magenta) and Rad51 (green) labelling visualize the DSB repair regions. Panel I shows the whole cell nuclei, whereas panels II–IV display the enlargement of the yellow-boxed repair regions. For (a) one ion track is enlarged and panel II shows the two-color overlay. It is visible that there are almost only magenta and green regions. This indicates that there is no correlation. The Rad51 signal shown in (a) panel III shows bright small spots, without any inner structure. The 53BP1 signal (a) panel IV appears with an inner nanostructure indicated by regions with high and regions with low intensity inside the ion track. For the cell irradiated by protons, the IRIF show anticorrelation in the overlay (b) panel II. The Rad51 (b) panel II again is visible in bright spots and the 53BP1 (b) panel III has again inner structure. V shows the rPDM analysis in both cases, pointing to mainly anticorrelation by showing quite exclusively white to blue regions and only few correlating red to yellow regions. Scale bar: 1 μm.

