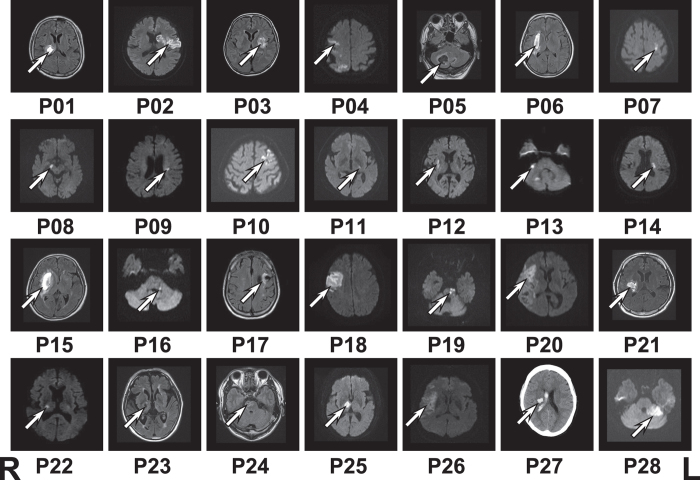
Figure 1. Lesion location of each patient.
Patient number is according to modality dominance of motor imagery, P01 to P8 for kinesthetic dominance and P9 to P28 for visual dominance. Lesion locations were shown by fluid attenuated inversion recovery (FLAIR) MRI scans for hemorrhagic stroke (P01, P03, P05, P06, P15, P21, P23, and P24) and by diffusion-weighted image (DWI) MRI scans for ischemic stroke (P02, P04, P07−P14, P16, P18−P20, P22, P25, P26, and P28). Lesion location of P17 with ischemic stroke was shown by FLAIR MRI scan. Lesion location of P27 with hemorrhagic stroke was shown by CT scan. Left side of the figure represents the right side of the brain.

