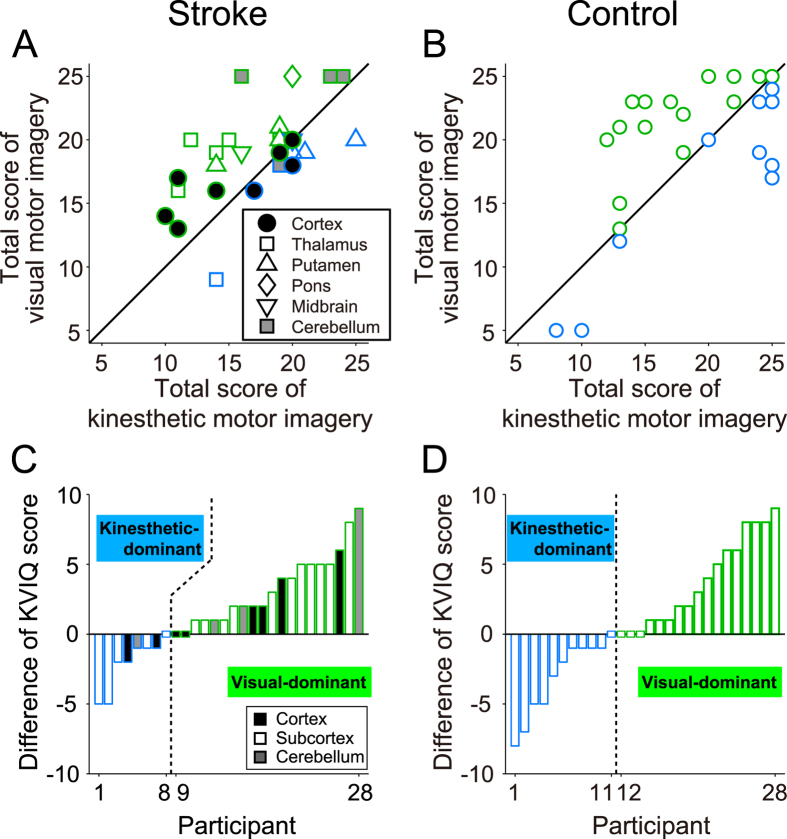
Figure 2. Individual differences in motor imagery ability and modality dominance.
Scatter plots illustrate the distributions of motor imagery abilities in stroke (A) and control (B) groups. In stroke group, lesion locations are represented by shapes and color (white/gray/black). Data points below/above the diagonal line correspond to participants with higher kinesthetic/visual motor imagery ability (blue/green). The differential values between kinesthetic and visual motor imagery scores were sorted in ascending order in the stroke group (C) and the control group (D). Blue and green bars indicate participants who were kinesthetic- and visual-dominant, respectively.

