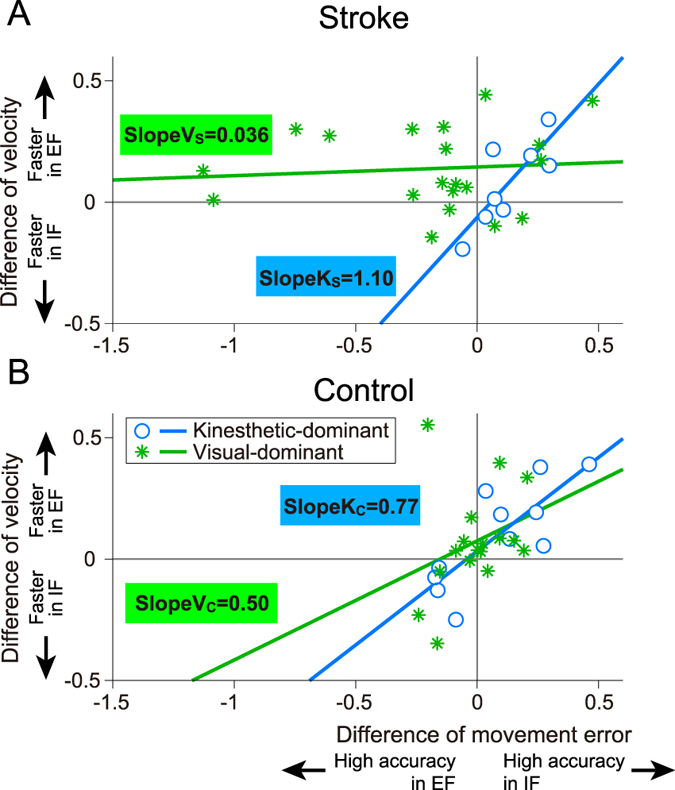
Figure 5.

Relationships between speed (i.e., normalized hand velocity) and accuracy (i.e., normalized movement error) in stroke (A) and control (B) groups. Circles and asterisks indicate participants with kinesthetic- and visual-dominant imagery, respectively. The visual-dominant subgroup of stroke patients did not exhibit the typical speed-accuracy trade-off.
