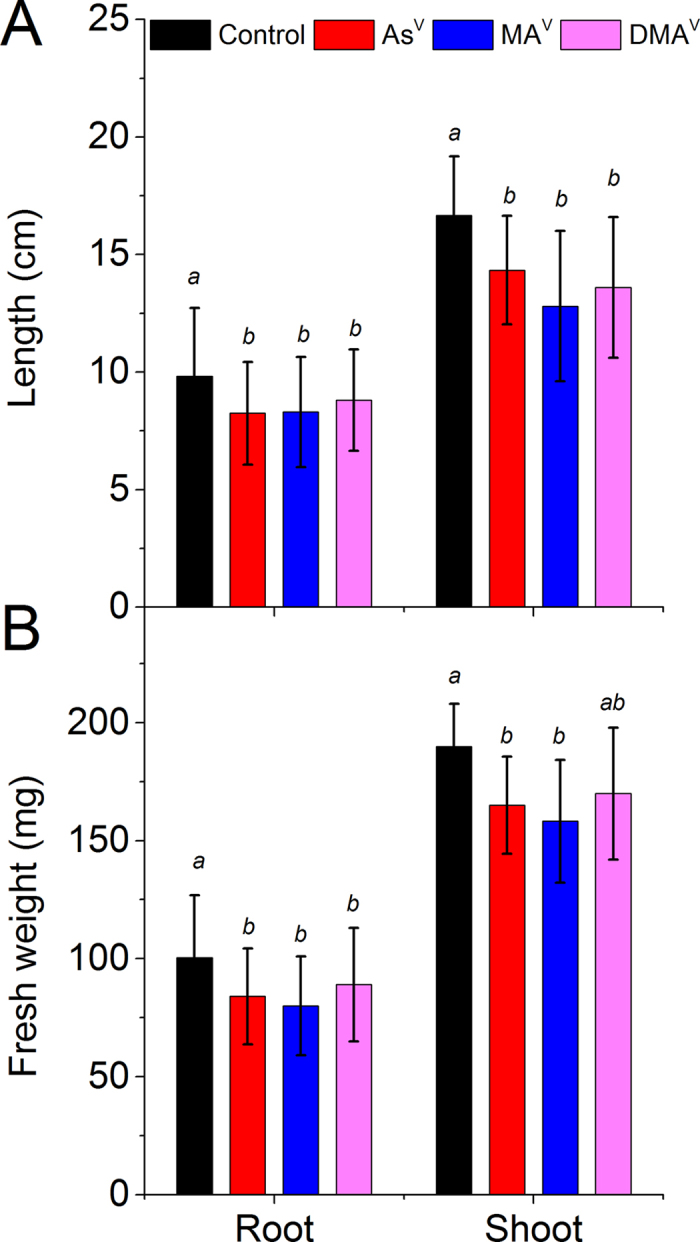
Figure 1. Growth of rice plant under control and after exposure to different species of As.

Plants were exposed to10 μM AsV or 50 μM MAV or 50 μM DMAV for 7 d. (A) Root and shoot length, (B) Root and shoot fresh weight. Values are mean ± SD, n = 30. Different letters indicate significantly different values within root and shoot (P ≤ 0.05).
