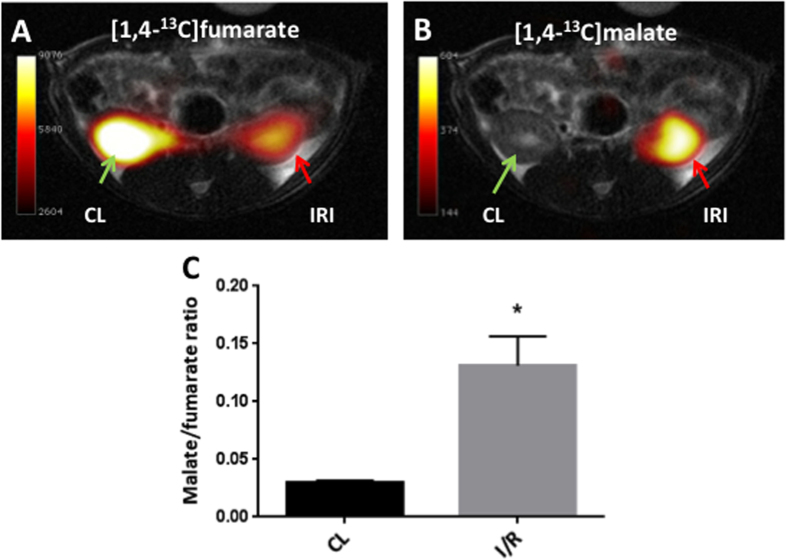
Figure 2. Magnetic resonance imaging maps and malate/fumarate ratios.
Representative anatomical 1H kidney sections from the post-ischemic animals overlaid with (A) 13C-labeled fumarate images, and (B) 13C-labeled malate images. (C) A malate/fumarate ratio calculated from each kidney (n = 6 CL, n = 6 IRI), giving rise to an elevated ratio in the post-ischemic kidney (p = 0.0065). The green arrow indicates the CL. The red arrow indicates the IRI kidney. A paired two-sided Student’s t-test was used to compare the CL and IRI kidneys. Blocks indicate means, while bars indicate the s.e.m. All relevant abbreviations as in Fig. 1.

