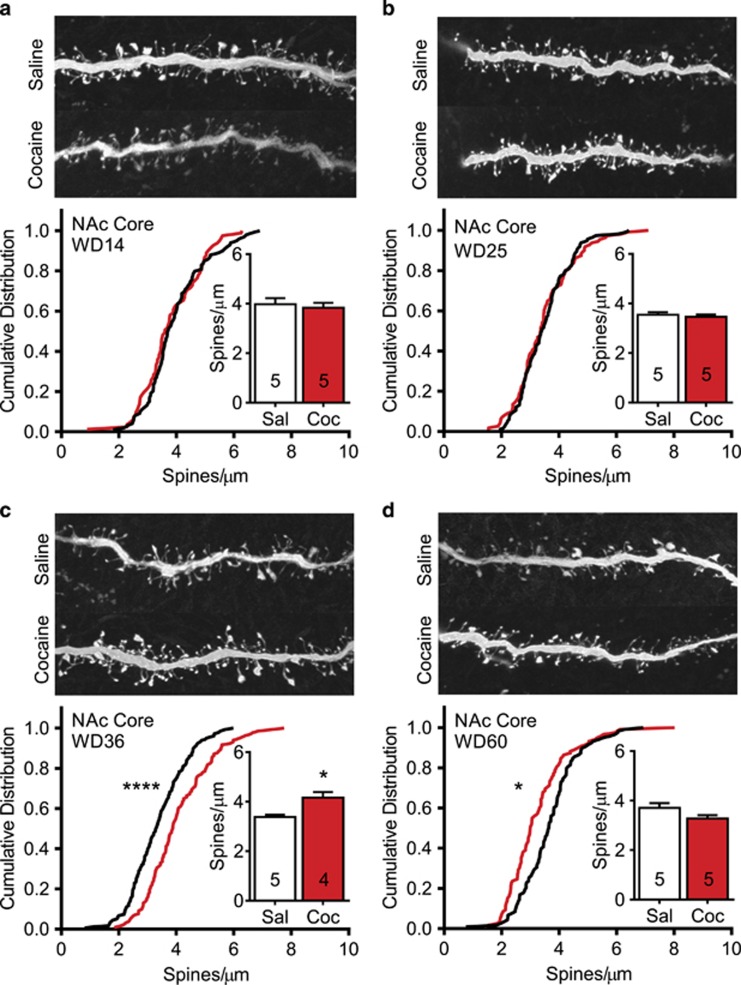
Figure 2.
Total spine density in medium spiny neurons of the nucleus accumbens (NAc) core undergoes time-dependent alterations after withdrawal from cocaine self-administration. (a–d) Top images show representative projected z-stack images (100x) from each experimental group. Bottom graphs show cumulative frequency distributions for every dendritic segment from all animals in a group (black line=saline; red line=cocaine). Inset graphs present mean total spine density averaged first by animal and then for the group. Numbers in bars represent the number of animals in each condition. (a) On withdrawal day 14 (WD14), no differences in total spine density or their cumulative distribution were observed between saline and cocaine groups. (b) On WD25, no differences in total spine density or their cumulative distribution were observed between saline and cocaine groups. (c) On WD36, a significant increase in total spine density and a significant shift of the cumulative distribution to the right were observed in the cocaine group. (d) On WD60, a reversal occurred such that the cumulative distribution of spines in the cocaine group was shifted significantly to the left. *p<0.05 and ****p<0.0001.

