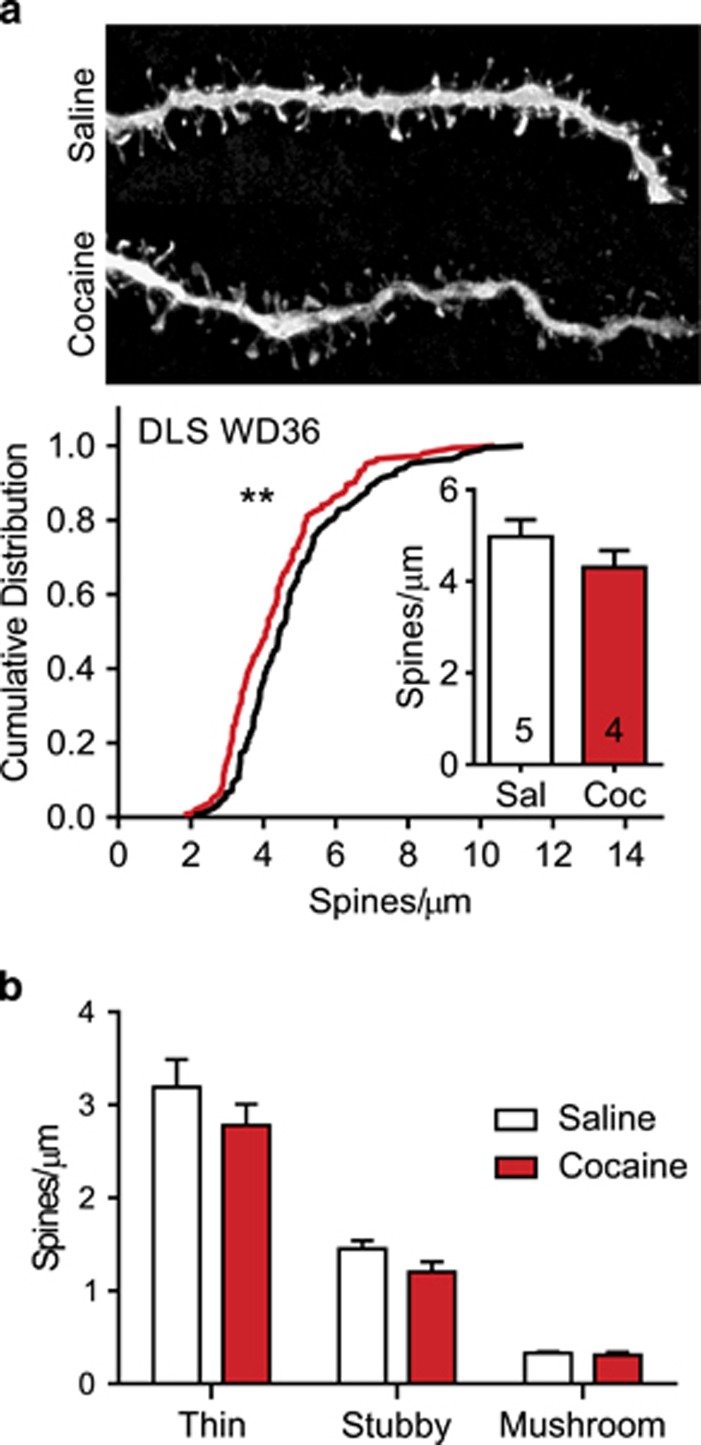
Figure 4.
Spine density in the dorsolateral striatum (DLS) on withdrawal day 36 (WD36) following saline or cocaine self-administration. (a) Top images show representative projected z-stack images (100x) from each experimental group. Bottom graphs show cumulative distributions for every dendritic segment from all animals in a group (black line=saline; red line=cocaine). Inset graphs present mean total spine density averaged first by animal and then for the group. Numbers in bars represent the number of animals in each condition. On WD36, total spine density did not differ between saline and cocaine groups. However, the cumulative distribution for cocaine segments was significantly shifted to the left. (b) No group difference in the density of any dendritic spine subtype was found in the DLS on WD36. **p<0.01.

