
Fig. 3.
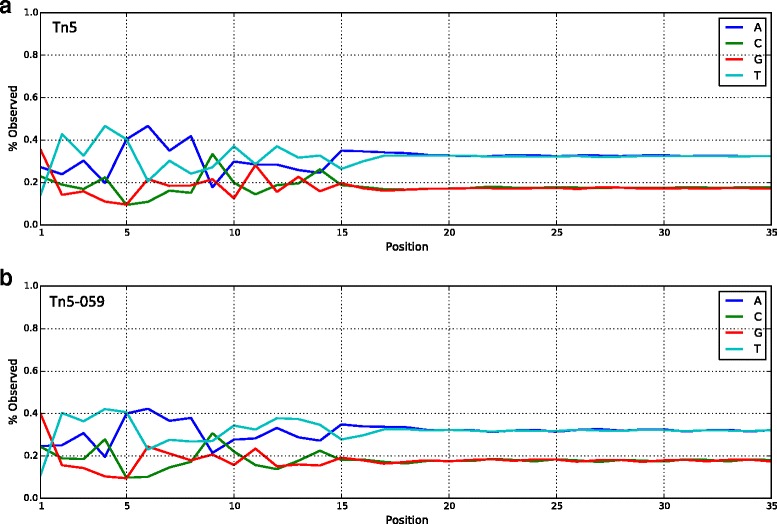
Percentage of observed bases at each cycle using standard Tn5 in NexteraV2 kit (a), or Tn5-059 (b) for sequencing B. cereus genomic DNA. In particular, the two plots differ at positions 3, 4, 6, 7, 11, 13 and 14. For Tn5-059, the bias within positions 10–15 is much closer to the overall genome composition