
Fig. 6.
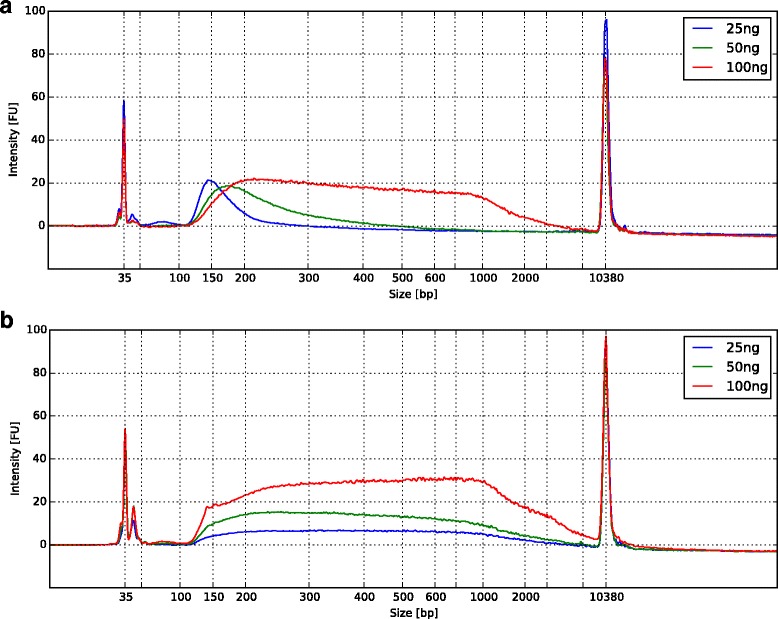
Fragment size distribution after tagmentation using Tn5 and Tn5-059. Horizontal axis is the fragment sizes in base pairs, vertical axis is the amount of observed fragments at different sizes in fluorescent units [FU] a Same concentration of Tn5 is applied to three different DNA inputs (25 ng, 50 ng or 100 ng). Lower DNA input shifts the fragment size distribution to the left, an indication of smaller fragments. b Tn5-059 demonstrates little changes in fragment size distribution over the same range of DNA input