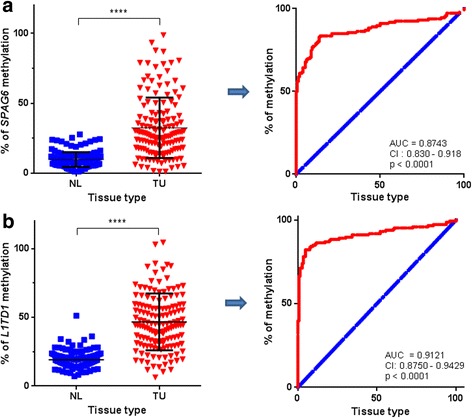
Fig. 3.

SPAG6 and L1TD1 methylation in NSCLC patients. Comparison of SPAG6 a and L1TD1 b methylation percentages in TU and NL samples of 146 NSCLC patients with each dot representing methylation percentages in an individual sample revealed statistically significant differences (****p < 0.0001). ROC curve analyses demonstrated that the extent of SPAG6 a and L1TD1 b methylation is able to distinguish between TU and NL samples. Blue line, reference line; red line, methylation of SPAG6; AUC, area under the curve; CI, confidence interval; TU, primary tumor sample; NL, normal lung tissue sample
