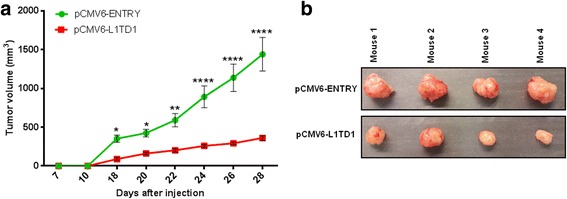
Fig. 6.

Xenograft tumor model. a Reduced volumes of xenograft tumors derived from pCMV6-L1TD1 compared to pCMV6-ENTRY transfected NCI-H1975 cells were observed and are shown as mean with SEM (**p = 0.0078 respectively p = 0.0075, ***p = 0.0003, ****p < 0.0001). b Differences in the size of xenograft tumors were confirmed after dissection. Upper panel: xenograft tumors expressing pCMV6-ENTRY, lower panel: xenograft tumors expressing pCMV6-L1TD1
