
Fig. 3.
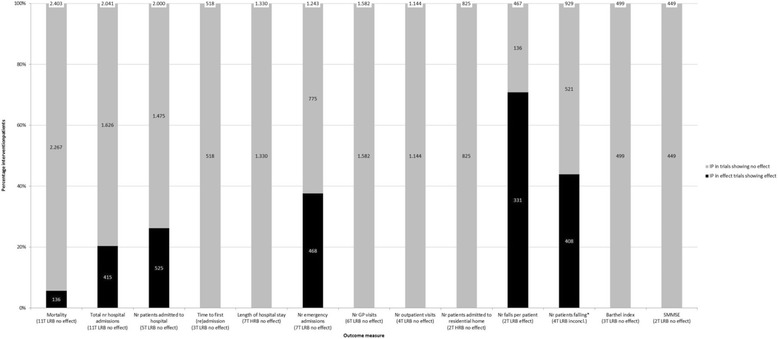
Effect of medication review on clinical outcome measures as assessed in more than 1 trial. The percentage of intervention patients is shown on the y-axis. The black part of the bar represents the percentage of intervention patients included in a trial with a positive effect on a specific outcome measure. The outcome measures, the number of trials using the specific outcome measure, the overall risk of bias of the set of evidence per outcome measure and the conclusion of the best evidence synthesis are shown on the x –axis. T = trials; LRB = low risk of bias; HRB = High risk of bias; inconcl. = inconclusive