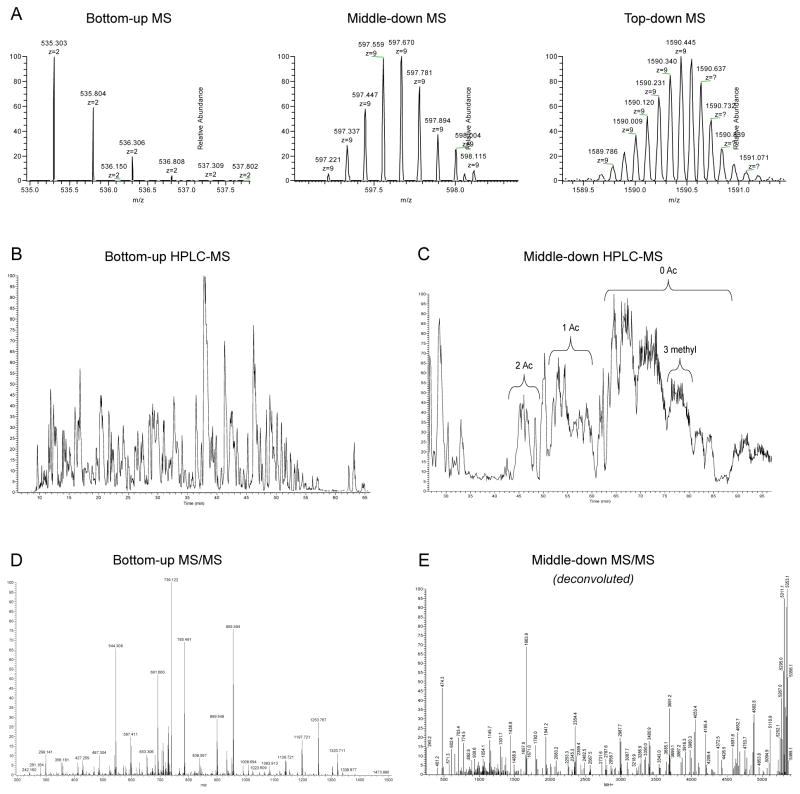
Figure 2. comparison of HPLC-MS performance for bottom-up and middle-down analysis.
A) Full MS scan performed at 60,000 resolution with an Orbitrap Fusion (Thermo Fisher Scientific) of a bottom-up-like peptide (1 kDa), a middle-down-like peptide (5 kDa) and a mass comparable to an intact histone (14–15 kDa). Higher masses lead to lower efficiency in resolving the isotopic distribution of the analyzed molecule. B) Reversed-phase HPLC separation of a histone mixture digested with trypsin after derivatization with propionic anhydride. Peptides are eluted in sharp, mostly baseline separated, peaks. C) WCX/HILIC separation of histone H3 N-terminal tails. The different peaks correspond to the same peptide sequence with different number of PTM equivalents. Heavily methylated and acetylated peptides elute first, while poorly modified tails elute in the final part of the chromatography. D) MS/MS spectrum of a bottom-up like peptide (1 kDa). E) Deconvoluted MS/MS spectrum of a middle-down-like peptide (5 kDa), where ETD fragmentation was used. On the right side of the spectrum the precursor mass and its respective neutral losses are the most abundant species in the spectrum, indicating that the fragmentation is not complete

