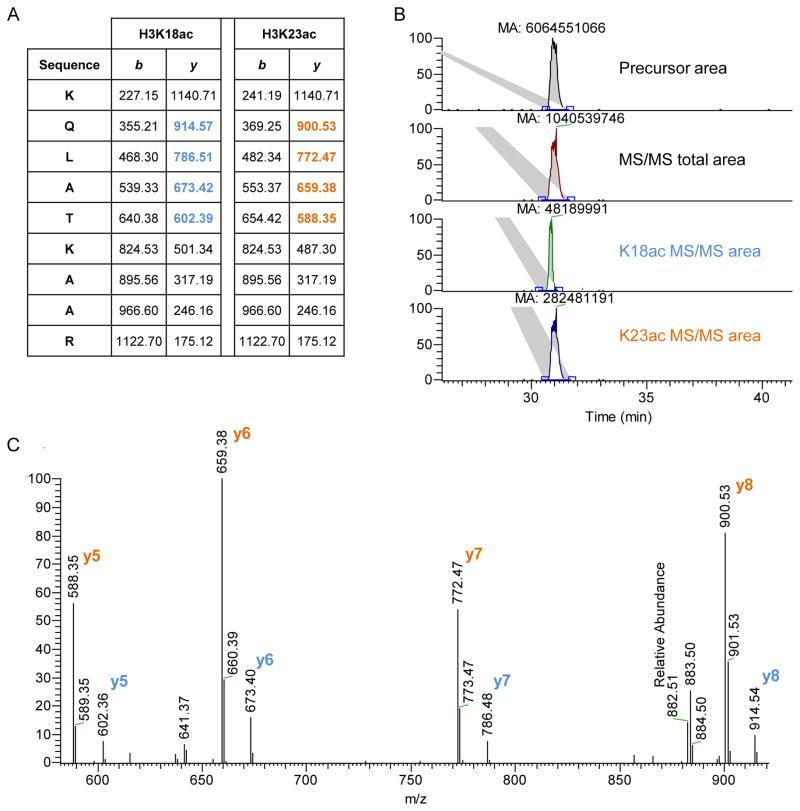
Figure 4. quantification of two co-eluted isobaric peptides.
A) The histone H3 peptide KQLATKAAR (aa 18–26) was found acetylated in both K18 and K23 residues. The two peptides generate different MS/MS fragments. We used the fragments y5–8 to calculate their relative abundance, as they were the most intense ones (highlighted). B) Extracted ion chromatogram of the precursor mass corresponding to the peptide sequence + one acetyl group (top) and the ion chromatography of the targeted MS/MS scans (top-middle). The extracted MS/MS ion chromatography generates a smaller area than the extracted precursor mass, as the fragmented peptide has a lower signal than the precursor mass. Below, extracted MS/MS ion chromatography of the fragments y5–8 of the K18ac (bottom-middle) and the K23ac peptide (bottom). The area of the K23ac chromatogram is about 6 times higher than K18ac. The total precursor area should then be divided by the two species according to their calculated ratio. C) MS/MS spectrum of co-fragmented K18ac and K23ac peptides. Also from the single MS/MS spectrum it is possible to calculate the ratio between K23ac and K18ac, which is about 6-folds.

