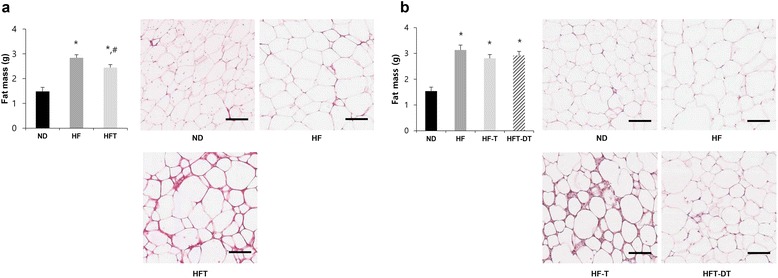
Fig. 3.

Abdominal visceral fat mass and histological changes after eight weeks of training and detraining. Fat mass and histological changes of adipose tissue after training (a) and detraining (b) are presented. Values are presented mean ± SE. ND; Normal-diet + sedentary group, HF; High-fat diet + sedentary group, HFT; High-fat diet + Training group, HF-T; Training group after chronic HFD, HFT-DT; Detraining group after completion of regular exercise. * p < 0.05; Significant difference with ND group, # p < 0.05; Significant difference with HF group. Scale bar = 100 μm
