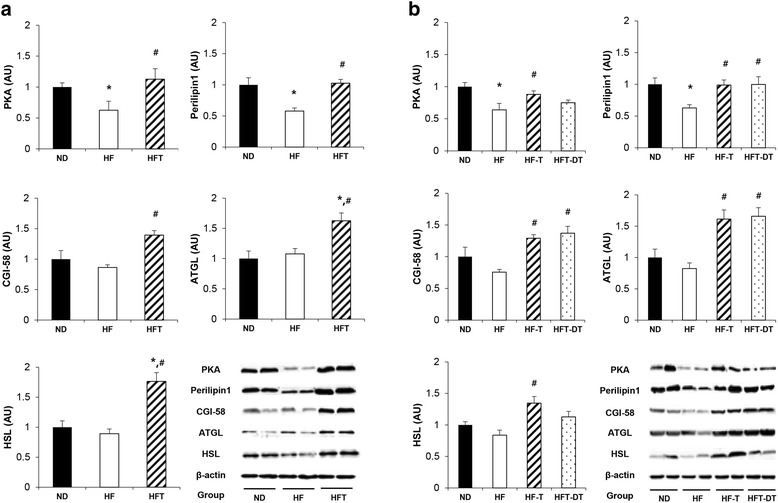
Fig. 4.

Expression level of proteins related to adipose tissue LD signaling pathway. Protein levels in the adipose tissue after training (a) and detraining (b) are presented. Values are presented mean ± SE. ND; Normal-diet + sedentary group, HF; High-fat diet + sedentary group, HFT; High-fat diet + Training group, HF-T; Training group after chronic HFD, HFT-DT; Detraining group after completion of regular exercise. * p < 0.05; Significant difference with ND group, # p < 0.05; Significant difference with HF group
