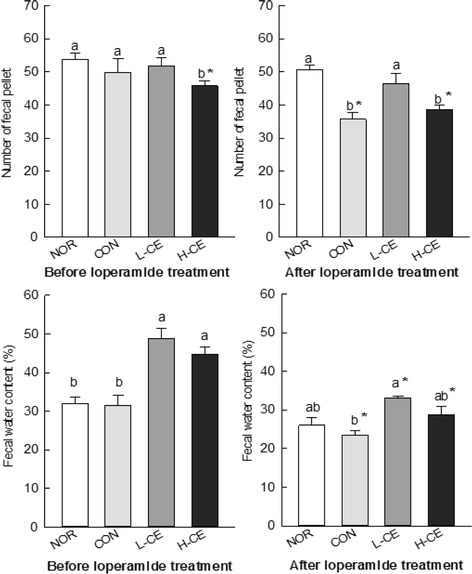
Fig. 1.

Effects of the CE on the number of fecal pellets (a) and fecal water content (b) before and after loperamide-induced constipation in a rat model. Bars represent the mean ± SD (n = 6). Different letters on each graph indicate significant differences (p < 0.05) among the groups. The asterisk indicates significant differences between respective groups before and after loperamide treatment, based on the Tukey’s test. CE, Cheonnyuncho extract; NOR, normal group; CON, constipation control group; L-CE, constipation plus low-dose CE group (3% CE added to drinking water); H-CE, constipation plus high-dose CE group (6% CE added to drinking water)
