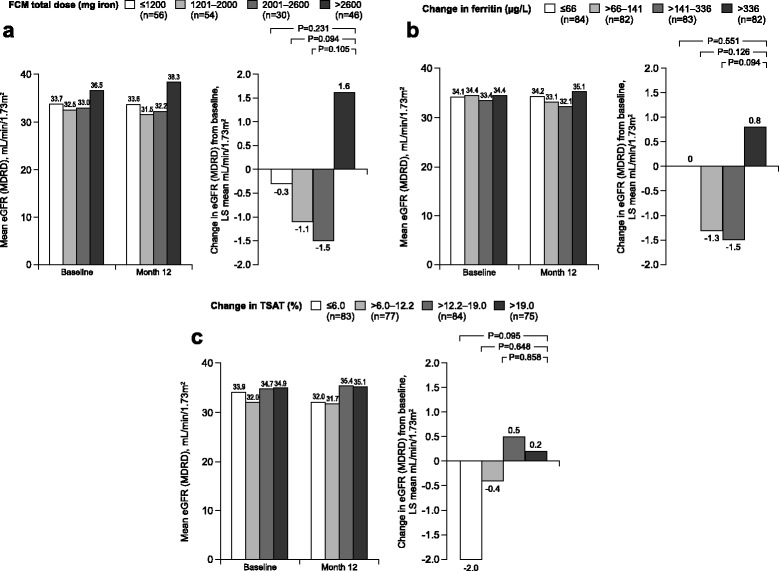
Fig. 2.

Absolute estimated glomerular filtration rate (eGFR) and change in eGFR from baseline to month 12 according to quartiles of (a) total ferric carboxymaltose (FCM) dose to month 12 in patients randomized to high ferritin FCM or low ferritin FCM (b) change in ferritin from baseline to month 12 across all treatment groups and (c) change in transferrin saturation (TSAT) from baseline at month 12 across all treatment groups. Data are shown for patients with eGFR values at baseline and month 12. Change in eGFR is shown as least squares (LS) mean values. MDRD, Modification of Diet in Renal Disease
