Fig. 3.

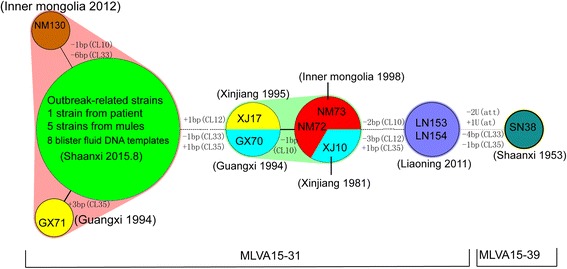
Minimum spanning tree of B. anthracis strain in MLVA15-31. Each circle denotes a SNR SGT and the halos surrounding the various subgenotype denote the complexes created by the maximum neighbor distance with two changes

Minimum spanning tree of B. anthracis strain in MLVA15-31. Each circle denotes a SNR SGT and the halos surrounding the various subgenotype denote the complexes created by the maximum neighbor distance with two changes