
Fig. 2.
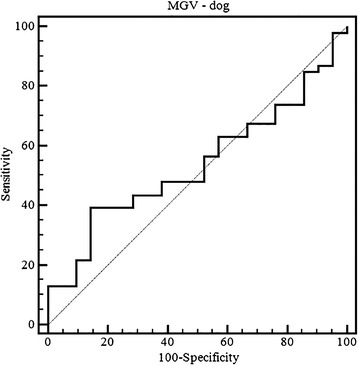
ROC curve analysis of the dog samples classified as normal (“no relevant findings”) and as pathological. (AUROC = 0.54; 95% confidence interval = 0.32–0.60). Choosing a cut-off value of 35 sensitivity was 39% and specificity was 86%)
Official websites use .gov
A
.gov website belongs to an official
government organization in the United States.
Secure .gov websites use HTTPS
A lock (
) or https:// means you've safely
connected to the .gov website. Share sensitive
information only on official, secure websites.
ROC curve analysis of the dog samples classified as normal (“no relevant findings”) and as pathological. (AUROC = 0.54; 95% confidence interval = 0.32–0.60). Choosing a cut-off value of 35 sensitivity was 39% and specificity was 86%)