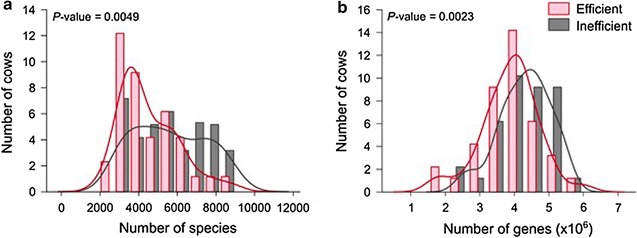
Fig. 1.

Community parameters of efficient and inefficient cows’ microbiomes (from Shabat et al. [46]). a, b Microbiome richness with counts calculated and expressed as simple richness: a Species (based on 16S rRNA amplicon sequencing) and b genes (based on metagenomics sequencing). Kernel density of the efficient and inefficient histograms emphasizes the different distribution of counts in each microbiome group. P values of the difference in richness between efficient and inefficient cows are shown
