Fig. 6.

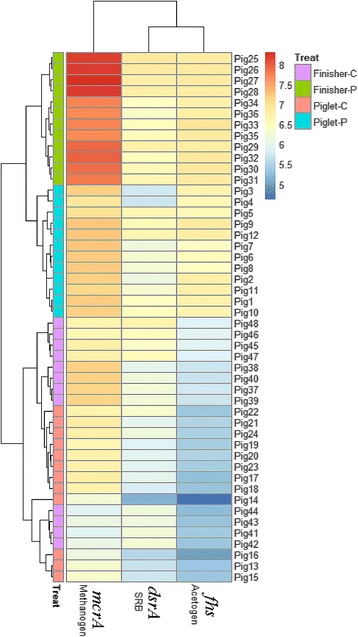
Heatmap distribution of copy numbers of mcrA, dsrA and fhs genes for all colonic samples based on qPCR data. Samples (mcrA, dsrA and fhs genes) are arranged in rows and clustered on the vertical axis (y-axis). Gene copies are arranged vertically and are on the horizontal axis (x-axis). Clustering was done for each using Phylotrac’s heatmap option with Pearson correlations and complete lineage algorithms. Different colors indicate relative abundance of the taxons. Different colors showed on the left side of the diagram indicate the four groups (Piglet-C, Piglet-P, Finisher-C and Finisher-P)
