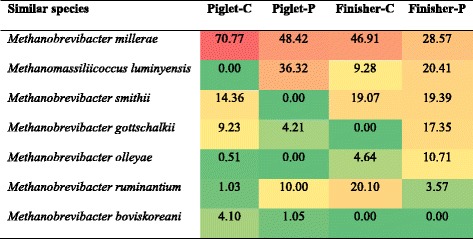
Table 4.
The proportion of most similar species in the four clone libraries (%)

The background color of each cell indicates relative abundance of each phylum with red and green indicating highest and lowest values
The proportion of most similar species in the four clone libraries (%)

The background color of each cell indicates relative abundance of each phylum with red and green indicating highest and lowest values