
Table 5.
The proportion of most closely related methanogenic clades in the four clone libraries (%)
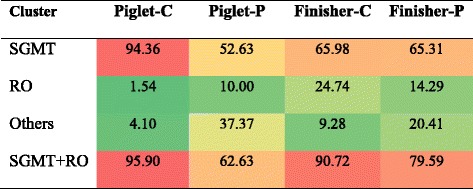
The background color of each cell indicates relative abundance of each phylum with red and green indicating highest and lowest values
Official websites use .gov
A
.gov website belongs to an official
government organization in the United States.
Secure .gov websites use HTTPS
A lock (
) or https:// means you've safely
connected to the .gov website. Share sensitive
information only on official, secure websites.
The proportion of most closely related methanogenic clades in the four clone libraries (%)
The background color of each cell indicates relative abundance of each phylum with red and green indicating highest and lowest values