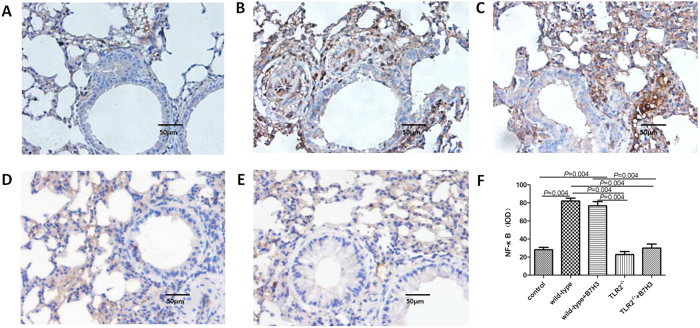
Figure 7. NF-kappaB-positive cells in various groups by immunohistochemistry detection.
Cells were counted and statistically analyzed (original magnification x400, scale bars = 50 μm). NF-kappaB expression in normal control group (A), wild-type group with asthma (B), recombinant mouse B7-H3 treatment group (C), TLR2-deficient mice group with asthma (D), TLR2-deficient mice with recombinant mouse B7-H3 treatment group (E), and values shown are mean ± SD (F).

