. 2017 Jan 17;7:40484. doi: 10.1038/srep40484
Copyright © 2017, The Author(s)
This work is licensed under a Creative Commons Attribution 4.0 International License. The images or other third party material in this article are included in the article’s Creative Commons license, unless indicated otherwise in the credit line; if the material is not included under the Creative Commons license, users will need to obtain permission from the license holder to reproduce the material. To view a copy of this license, visit http://creativecommons.org/licenses/by/4.0/
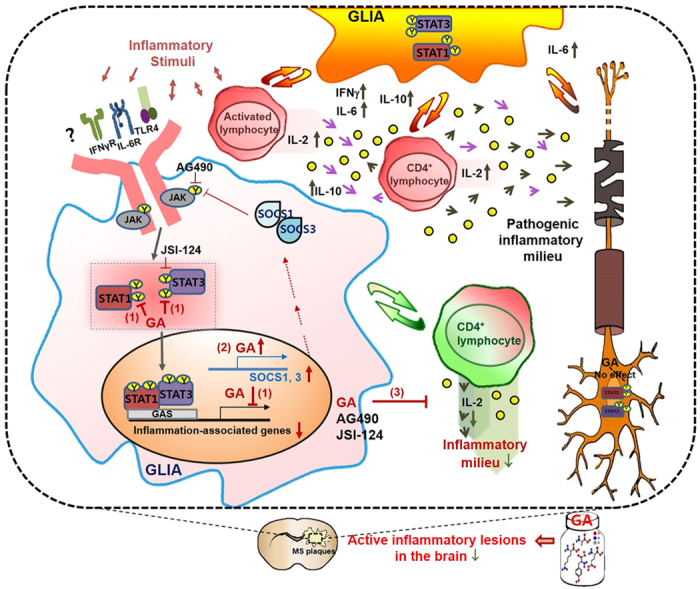
Figure 11. Schematic diagram showing possible actions of GA MS-related brain lesions.

