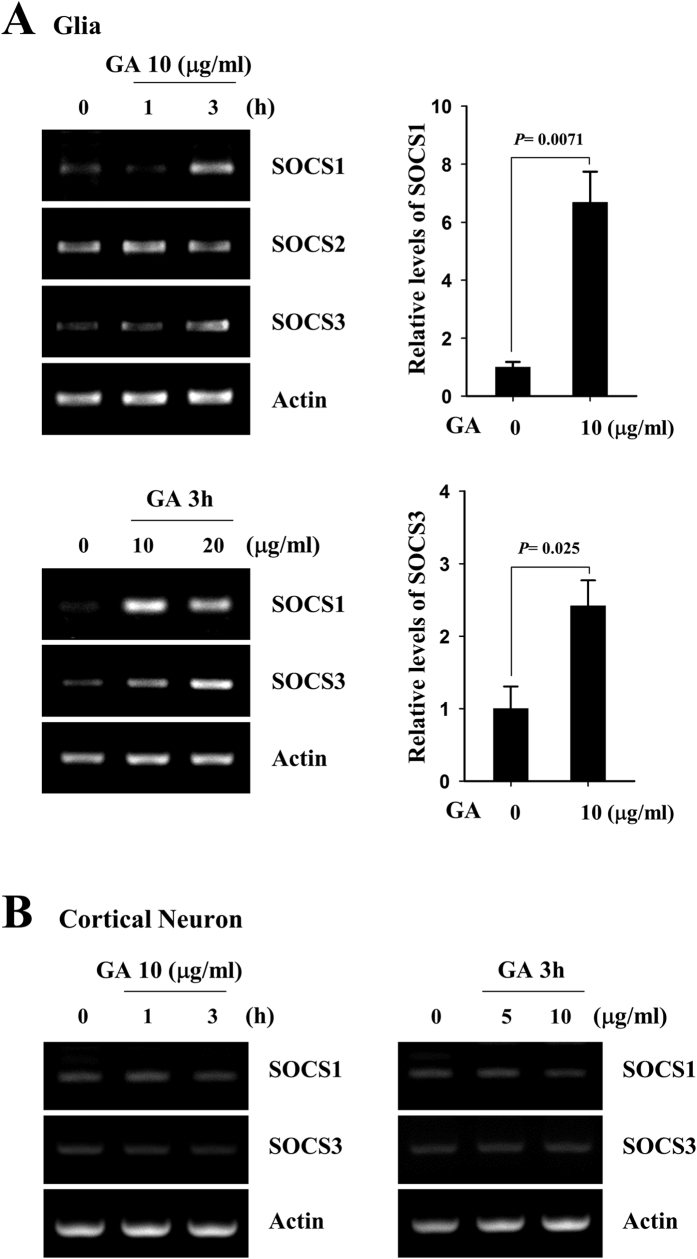
Figure 8. GA elevates the expression levels of SOCS1 and −3 in primary microglia but not in cortical neuronal cells.
(A) Primary microglia or (B) cortical neuronal cells were mock-treated or treated with the indicated concentration of GA for 1 h or 3 h. The transcript levels of SOCS 1 and −3 were measured by RT-PCR analysis, and the results were quantified with the Image J software. The results shown represent the mean ± SD of triplicate experiments and are representative of three individual experiments.

