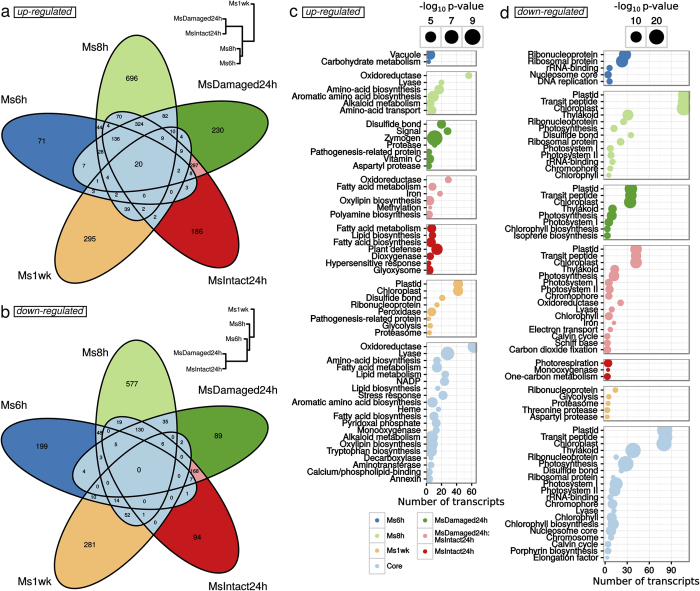
Figure 4. Functional classification of differentially expressed transcripts in leaves of C. roseus fed by M. sexta compared to undamaged control leaves.
For each of the 5 comparisons ((Ms6h/Ctrl6h, Ms8h/Ctrl8h, MsDamaged24h/Ctrl24h, MsIntact24h/Ctrl24h and Ms1wk/Ctrl1wk), lists of significantly (p < 0.001) up-regulated (a,c) or down-regulated transcripts (b,d) were analyzed with Venn diagrams (a,b). In a and b, hierarchical clustering trees depict dissimilarities between samples calculated on the 2,588 and 1,745 transcripts that were respectively significantly up-regulated or down-regulated in at least one comparison. Intersections between these lists were used to identify core sets of herbivory-modulated transcripts (modulation at least at two different sampling times) clear blue sectors) and sample-specific transcripts (other sectors). The pink sectors correspond to transcripts commonly modulated both in MsDamaged24h and MsIntact24h and were therefore not included in the core sets. (c,d) Uniprot keyword classification of lists of differentially accumulated transcripts. The number of transcripts is indicated for each term by a dot in which the diameter is proportional to the p-value of enrichment testing (Hypergeometric distribution). Only keywords attributed to more than 2 transcripts and that were significantly enriched (Hypergeometric distribution, p-value < 0.001) are represented. Lists of up- and down-regulated transcripts are available in Supplementary Tables S1 and S2 respectively. Details for Uniprot keyword analysis are presented in Supplementary Table 3.

