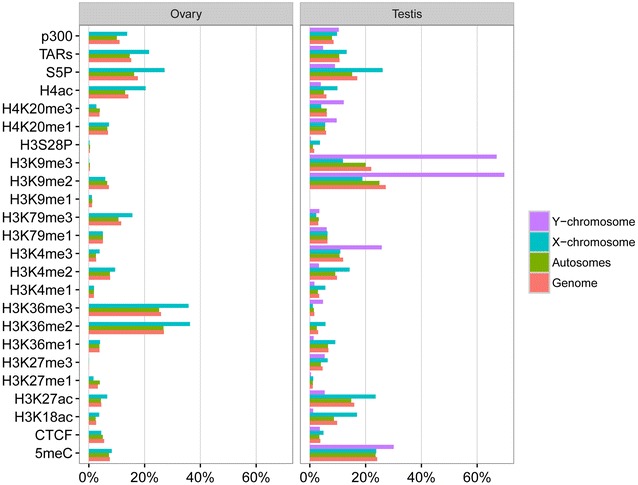
Fig. 1.

Percentage of genome, autosomes, X- and Y-chromosomes covered by ChIP-enriched regions for each ChIP sample, as well as percentages of the genome covered by transcriptionally active regions (TARs) (using previously published tiling array data from [32], and their definition of a TAR as “any stretch of consecutive positive probes in a particular sample”), in the O. dioica ovary and testis
