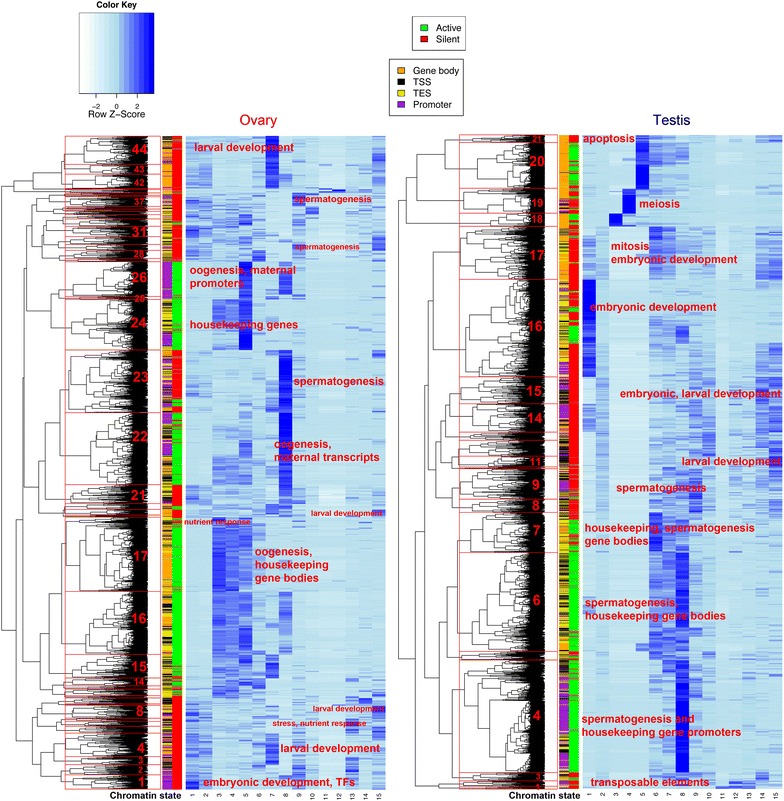
Fig. 3.

Gene ontology chromatin state enrichments (light to dark blue = low to high enrichment) in promoters (purple), gene bodies (orange), TSSs (yellow) and TESs (black) of active (green) and silent (red) genes grouped by GO term and clustered. Selected clusters are labeled with representative functions and numbered, to facilitate reference in “Results” section and in Additional file 3: Table S5
