Fig. 4.

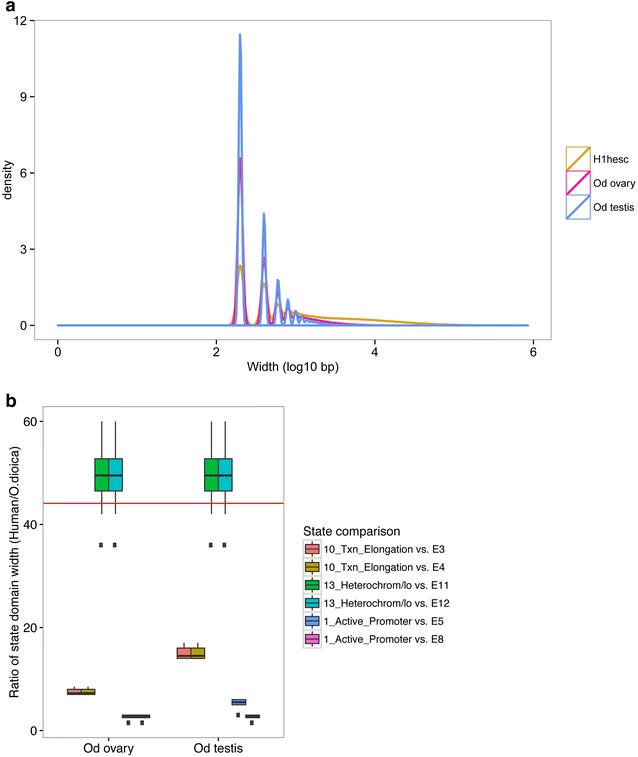
Compact chromatin state domains in the O. dioica epigenome. a Distributions of all chromatin state domain widths for each cell type in O. dioica compared to those in human embryonic stem cells (H1-hESC) [92]. O. dioica domain widths were adjusted for the difference in resolution (50 vs. 200 bp) by rounding O. dioica widths up to the nearest 200 bp. b Comparison of the ratios of human state domain widths for active promoters, transcriptional elongation and heterochromatin (see Additional file 2: Fig. S6) to corresponding state domains in O. dioica. Each box summarizes the ratios of median domain widths (y-axis) for the human cell lines relative to the similar domains in each O. dioica tissue (x-axis). The red line indicates the ratio of the human genome size to that of O. dioica (44-fold smaller). Relative to the genome compaction, heterochromatin domains in O. dioica are disproportionately more compact
