Fig. 2.

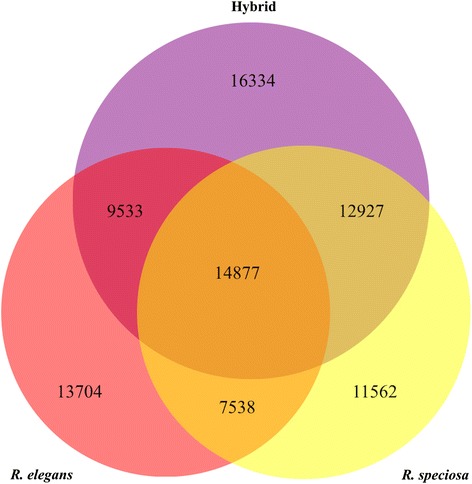
Venn diagram showing the total number of unigenes from each of three assemblies (R. elegans, R. speciosa, and the hybrid) and the numbers of unigenes shared between each pair of assemblies as well as all three assemblies

Venn diagram showing the total number of unigenes from each of three assemblies (R. elegans, R. speciosa, and the hybrid) and the numbers of unigenes shared between each pair of assemblies as well as all three assemblies