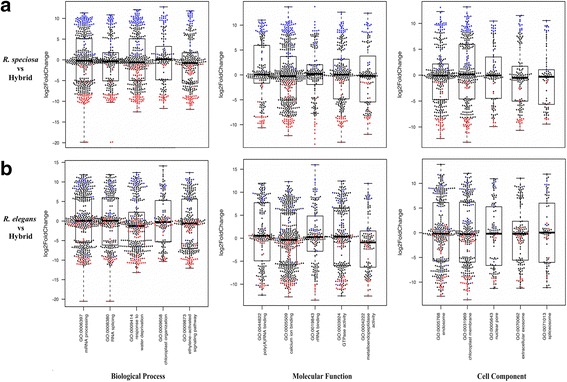
Fig. 4.

Box plots of the top five most significant GO terms in gene enrichment analyses. Individual gene fold-changes shown by dots. a Using the hybrid as a reference, DEGs with higher expression levels were colored blue and DEGs with lower expression levels were colored red. b Shared DEGs between two comparisons were colored as in 4A regardless of their expression levels. Thus, blue dots above zero in 4B means that DEGs had lower expression levels in the hybrid compared to both parents while blue dots below zero in 4B stands for DEGs expression levels was between two parents
