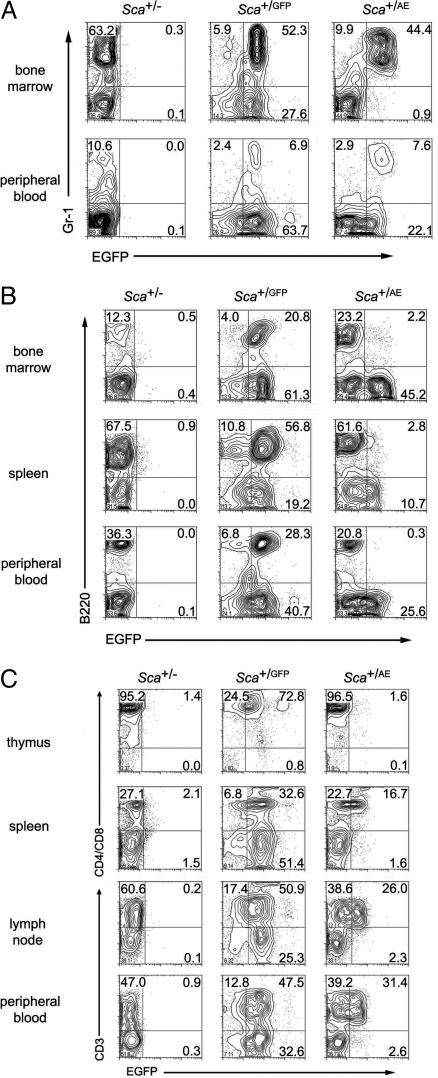
Fig. 2.
Flow cytometric analysis. (A) Flow cytometric analysis was performed by using cells from mice heterozygous at the Sca1 locus for a null, GFP, or AML1/ETO ires GFP allele. Most of the myeloid (Gr1+) cells express GFP in the bone marrow and peripheral blood of Sca+/GFP and Sca+/AE mice. (B) In contrast to identically targeted Sca+/GFP mice, Sca+/AE mice demonstrate low level transgene expression in B220+ cells. (C) T cells from Sca+/AE mice express significantly lower transgene levels compared with cells from Sca+/GFP mice.

