
Fig. 3.
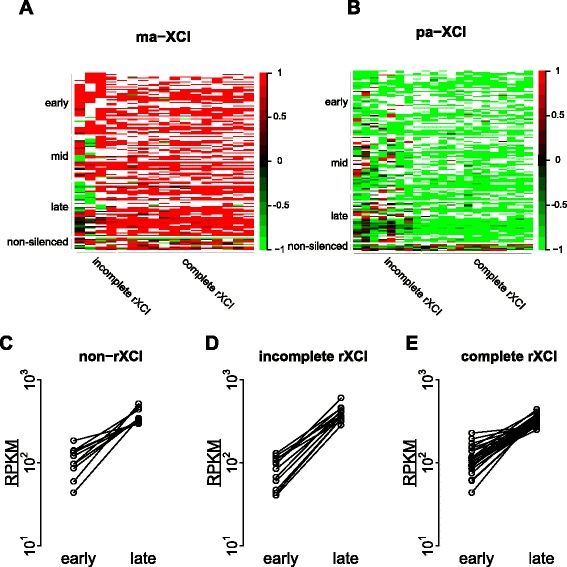
Dynamics of X chromosomal gene silencing. a The gene cluster in ma-XCI; the cells were ordered by the proportion of inactive genes. The colour represented the d value for each gene in each cell. White represented a missing value. b The gene cluster in pa-XCI, with similar annotations. c, d, e Expression levels of genes measured by the means of normalized RPKMs (RPKM) in the early and late inactivation sets during the non-rXCI stage, incomplete rXCI stage and complete rXCI stage, respectively