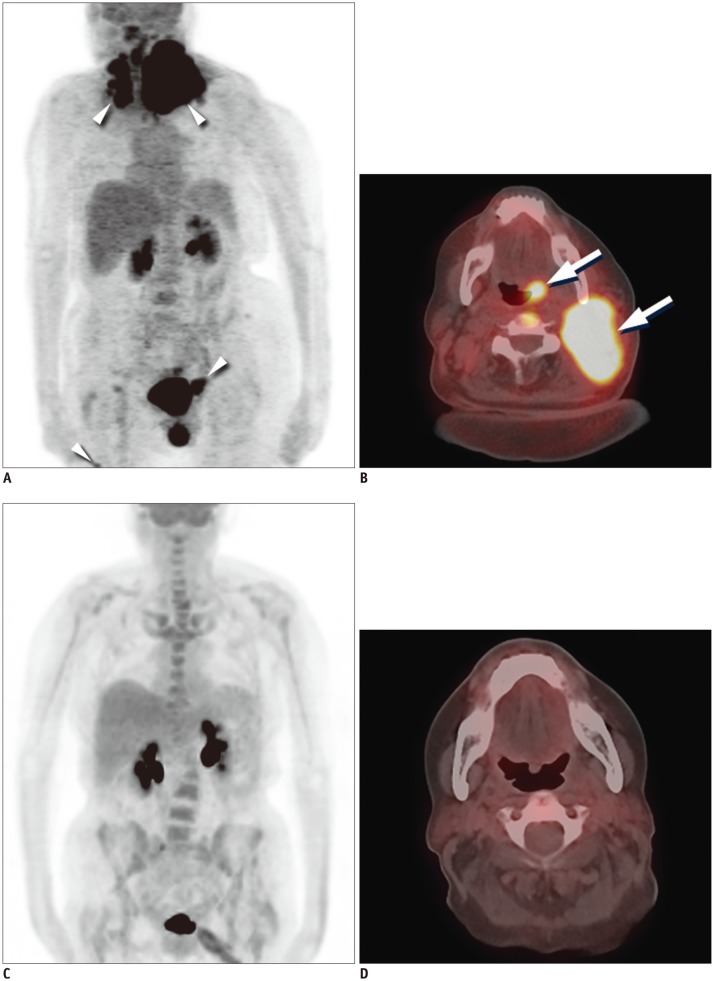
Fig. 3. 18FDG PET-CT in patient with peripheral T-cell lymphoma, not otherwise specified with treatment response.
Baseline MIP (A) and axial fusion (B) PET-CT images demonstrate intense 18FDG uptake in left neck corresponding with large soft tissue mass and intense 18FDG uptake in left base of tongue (arrows). Additional sites of 18FDG uptake are seen in upper paratracheal region, inguinal stations, and right thigh (arrowheads). Post treatment MIP (C) and axial fusion (D) images following treatment with RCHOP and neck radiation demonstrate resolution of 18FDG uptake and soft tissue mass. FDG = flourodeoxyglucose, MIP = maximum intensity projection, PET = positron emission tomography

