Abstract
Objective
To prospectively evaluate the performance of diffusion-weighted imaging (DWI) to monitor bowel inflammation after medical therapy for Crohn's disease (CD).
Materials and Methods
Before and following 1–2 years of medical therapy, between October 2012 and May 2015, 18 randomly selected adult CD patients (male:female, 13:5; mean age ± SD, 25.8 ± 7.9 years at the time of enrollment) prospectively underwent MR enterography (MRE) including DWI (b = 900 s/mm2) and ileocolonoscopy. Thirty-seven prospectively defined index lesions (one contiguous endoscopy-confirmed inflamed area chosen from each inflamed anatomical bowel segment; 1–4 index lesions per patient; median, 2 lesions) were assessed on pre- and post-treatment MRE and endoscopy. Visual assessment of treatment responses on DWI in 4 categories including complete remission and reduced, unchanged or increased inflammation, and measurements of changes in apparent diffusion coefficient (ΔADC), i.e., pre-treatment–post-treatment, were performed by 2 independent readers. Endoscopic findings and CD MRI activity index (CDMI) obtained using conventional MRE served as reference standards.
Results
ΔADC significantly differed between improved (i.e., complete remission and reduced inflammation) and unimproved (i.e., unchanged or increased inflammation) lesions: mean ± SD (× 10-3 mm2/s) of -0.65 ± 0.58 vs. 0.06 ± 0.15 for reader 1 (p = 0.022) and -0.68 ± 0.56 vs. 0.10 ± 0.26 for reader 2 (p = 0.025). DWI accuracy for diagnosing complete remission or improved inflammation ranged from 76% (28/37) to 84% (31/37). A significant negative correlation was noted between ΔADC and ΔCDMI for both readers with correlation coefficients of -0.438 and -0.461, respectively (p < 0.05).
Conclusion
DWI is potentially a feasible tool to monitor quantitatively and qualitatively bowel inflammation of CD after medical treatment.
Keywords: Crohn, Crohn's, Diffusion, Diffusion-weighted, Magnetic resonance, Magnetic resonance enterography, Longitudinal, Follow-up, Monitoring
INTRODUCTION
The use of diffusion-weighted imaging (DWI) has recently been expanded to enterographic evaluations of the bowel inflammation in patients with Crohn's disease (CD) (1,2). Disease-modifying therapy for CD using biologics or immunosuppressive agents aims to achieve mucosal healing beyond symptomatic control (3,4,5,6). This has created an increased need for imaging examinations to monitor treatment responses in a more objective quantitative manner. In addition to providing images, DWI intrinsically provides a quantitative parameter i.e., the apparent diffusion coefficient (ADC). Therefore, the role of DWI as a potential quantitative tool to monitor treatment responses in CD is drawing attention (2). Previous studies have consistently shown heterogeneous correlations between the degrees of mural diffusion restriction on DWI and the severity of bowel inflammation in CD (7,8,9,10,11,12,13,14). However, the level of evidence provided by the cross-sectional correlation studies that analyse a single time-point in subjects with different severities of bowel inflammation is indirect and weak. A more robust evaluation of DWI for post-therapeutic monitoring of bowel inflammation requires a direct longitudinal follow-up study that includes comparative analyses between pre- and post-treatment imaging results obtained from the same patient (2). To the best of our knowledge, longitudinal studies regarding the use of DWI for post-therapeutic follow-up of CD have been very rare and no prospective studies have been reported. One recent retrospective study (15) showed that ADC values measured in the bowel wall of CD patients significantly increased in clinical responders after anti-tumor necrosis factor-alpha (anti-TNF-α) therapy, but did not change significantly in clinical non-responders. Despite its importance as the first such longitudinal study, the study (15) had limitations such as physician's global assessment as a reference standard, which may not be as precise as endoscopic correlation (16,17), in addition to the retrospective design. While the pathological basis of mural diffusion restriction in CD remains poorly understood (2), a few studies (9,18,19) have also revealed an association between bowel fibrosis in CD and reduced mural ADC. However, active bowel inflammation and bowel fibrosis often co-exist in patients with CD (20,21). For these reasons, establishing more definitive cause-and-effect evidence regarding the relationship between bowel inflammation of CD and mural diffusion restriction on DWI through a prospective longitudinal study is important. This prospective longitudinal study was conducted to evaluate the performance of DWI to monitor bowel inflammation in CD after medical therapy.
MATERIALS AND METHODS
Ethical Considerations
This study was approved by the Institutional Review Board of Asan Medical Center. Informed consent was obtained from participants.
Patients
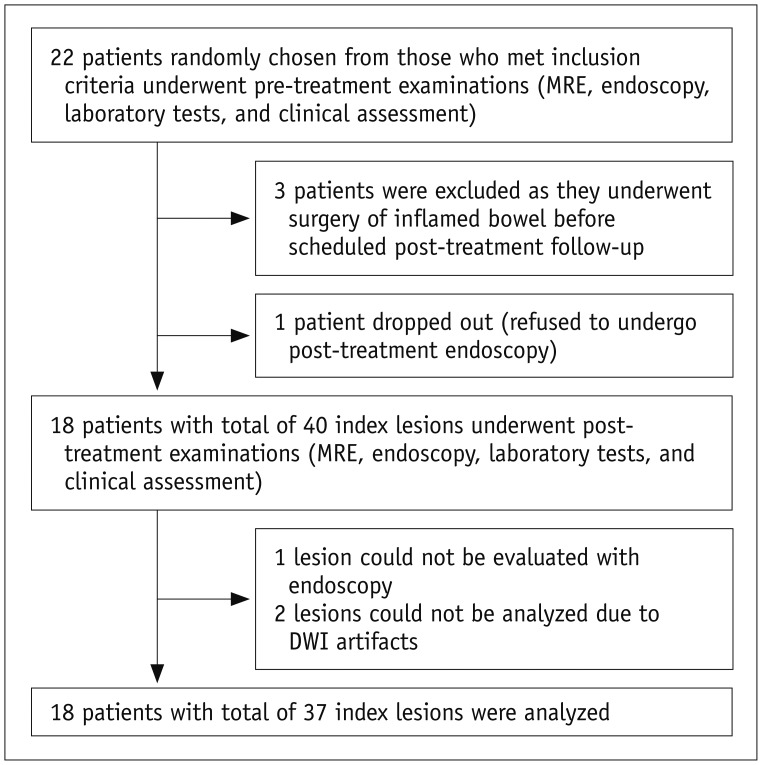
patients were recruited prospectively by randomly selecting 50% of individuals from a cohort of 44 CD patients included in a previous study (22) that investigated a non-overlapping topic. Despite the patient overlap, there was no overlap in data and analysis. The 44-patient cohort was identified at the Inflammatory Bowel Disease Center of Asan Medical Center, a tertiary referral institution, between October 2012 and December 2013 (according to the time of study enrollment) and met the following criteria: 1) adults (≥ 18 years old) who were newly diagnosed with CD, 2) no history of bowel resection surgery, 3) no emergency care required, and 4) no gross technical inadequacy in their first study MR enterography (MRE). The previous study (22) recruited a total of 50 patients, of whom 6 were later excluded as they did not fulfill study criteria. A binary sequence (i.e., inclusion vs. exclusion) designed to randomly select a half from a group of patients was prospectively applied as the recruitment of 50 patients continuously progressed. A total of 22 patients were randomly chosen finally (i.e., 1/2 of 44 patients as 6 patients were excluded after initial study assessment) and were scheduled to undergo follow-up MRE and ileocolonoscopy after therapy (see “Study Procedures” section). Given the exploratory nature of this study, we determined the sample size not through a formal calculation but included as many patients as possible within the study fund capacity (two MRE examinations per patient were funded). As the research fund was only able to accommodate an approximate half of the original consecutive cohort, we used random selection to minimize selection bias. Three patients then underwent surgical resection of the inflamed bowel after the random selection and another patient declined post-treatment ileocolonoscopy. As a result, 18 patients (13 men and 5 women; mean age ± SD, 25.8 ± 7.9 years at enrollment) were finally included in this study (Fig. 1). Detailed patient characteristics were summarized in Table 1. The diagnosis of CD was made according to established clinical, radiological, endoscopic, and histopathological criteria (23,24).
Fig. 1. Flow diagram of study subjects.
DWI = diffusion-weighted imaging, MRE = MR enterography
Table 1. Characteristics of Study Subjects Analyzed.
| Before Treatment | After Treatment | |
|---|---|---|
| Patients included (n = 18) | ||
| Age, years (mean ± SD) | 25.8 ± 7.9 | 27.1 ± 7.8 |
| Gender (M:F), patient number | 13:5 | 13:5 |
| Body mass index, kg/m2 (mean ± SD) | 20.4 ± 3.2 | 22.5 ± 3.4 |
| CDAI (mean ± SD) | 194.3 ± 143.3 | 71.7 ± 66.4 |
| ESR, mm/hr (mean ± SD) | 50.7 ± 29.8 | 23.6 ± 25 |
| CRP, mg/dL (median [range]) | 2.3 (0.33–12.73) | 0.21 (0.1–7.29) |
| Index lesions analyzed (n = 37)* | ||
| Number of lesions | 37 | |
| TI, Rt, T, D, S, R | 12, 12, 3, 6, 3, 1 | |
| Endoscopic response to therapy | ||
| Complete remission | 14 | |
| Reduced inflammation | 19 | |
| Unchanged inflammation | 3 | |
| Increased inflammation | 1 | |
| CDMI score (mean ± SD)† | 5.7 ± 1.9 | 2.3 ± 2.5 |
*Data indicate number of lesions unless specified otherwise, †Crohn's disease MRI activity index was calculated according to method that was previously validated (29,30). CDAI = Crohn's disease activity index, CDMI = Crohn's disease MRI activity index, CRP = C-reactive protein, D = descending colon, ESR = erythrocyte sedimentation rate, R = rectum, Rt = right colon (including cecum and ascending colon), S = sigmoid colon, T = transverse colon, TI = terminal ileum
Study Procedures
Each of the 18 patients underwent clinical assessments, including measurements of CDAI, laboratory tests, MRE, and ileocolonoscopy, within a week both at the initial evaluation and following 1 year (14 patients) or 2 years (4 patients) of medical therapy (immunosuppressive agent in 11 patients, concomitant anti-TNF-α and immunosuppressive agent in 5 patients, and 5-aminosalicylate in 2 patients). The follow-up interval was chosen based on several factors. First, annual (or biennial) imaging follow-up is typically used in clinical practice, although more frequent imaging examinations may be acceptable in research studies. Conformity to actual clinical practice translates clinical relevance. Second, endoscopic complete remission is the present therapeutic goal in disease modifying therapies for CD (3,4,5,6), so it is important to design a study to allow for a meaningful analysis of the diagnosis of endoscopic complete remission. Complete endoscopic remission in CD generally takes a long time to achieve; for example, the reported rates of complete remission for anti-TNF-α therapy were 19–30% after either 6 months or 1 year of treatment (25,26,27).
Pre-Treatment Examinations
MRE was performed after oral administration of 1500 mL 2.5% sorbitol solution with a 3T scanner (Ingenia; Philips Healthcare, Best, The Netherlands). The detailed sequences and scan parameters were provided in Supplementary Table 1 (in the online-only Data Supplement). Briefly, these included coronal T2-weighted half-Fourier sequences without and with fat suppression, coronal and axial T2-like steady-state gradient-echo sequences with fat suppression, coronal free-breathing DWI (b-factors = 0 and 900 s/mm2) and an ADC map, coronal T1-weighted spoiled gradient-echo sequences with fat suppression including unenhanced scan and enteric- and portal-phase scans after the intravenous administration of 0.2 mL/kg body weight of gadoterate meglumine (Dotarem; Guerbet, Villepinte, France) at a rate of 2 mL/s followed by a saline flush, and an axial delayed contrast-enhanced T1-weighted spoiled gradient-echo sequence with fat-suppression. To achieve aperistalsis throughout the examination, 10 mg scopolamine-N-butyl bromide (Buscopan; Boehringer Ingelheim, Ingelheim, Germany) was administered thrice intravenously at the start of the examination, before DWI, and before obtaining the T1-weighted sequences.
Ileocolonoscopy was performed by one of the three board-certified gastroenterologists (each with experience in performing more than 1000 colonoscopy examinations in patients with CD) using a video colonoscope (CF H260AL or CF H260AI; Olympus Optical Co., Tokyo, Japan). The gastroenterologists were aware of the diagnosis of CD but blinded to the MRE results, clinical assessments, and laboratory tests. Multiple images were captured in each anatomical bowel segment (i.e., the terminal ileum, right colon [cecum and ascending colon], transverse colon, descending colon, sigmoid colon, and rectum) and the entire examination was video recorded. Inflammatory bowel lesions were assessed in detail, and their location, extent, and nature (overt ulcer, aphthoid lesions, erythema, and edema) were recorded.
Selection of Index Lesions
We selected index lesions according to predetermined criteria instead of following entire anatomical bowel segments, because the latter method could substantially confound the results although it has an advantage of enabling the use of more standardized endoscopic scoring systems such as CD endoscopic index of severity (28) as a reference standard. First, while the standardized endoscopic scoring systems generate scores per each entire anatomical bowel segment, quantitative ADC measurements to encompass each entire anatomical bowel segment using a region-of-interest (ROI) approach are essentially impossible because of the convoluted tubular shape of the bowel. Second, CD frequently affects multiple bowel areas with different inflammatory severities even in a single anatomical segment, and each area may respond heterogeneously to therapy. Therefore, evaluating a bowel segment as a whole entity without precise location-by-location matching between DWI and the reference standards can be inaccurate and misleading. One index lesion was chosen for each inflamed anatomical bowel segment according to predefined selection criteria i.e., a contiguous endoscopy-confirmed inflamed bowel area that was clearly observed on both DWI and non-DWI MRE images without remarkable image artifacts and showed the most severe inflammation as assessed with endoscopy. The index lesions were chosen in consensus by a radiologist and a gastroenterologist who were experienced in analyzing CD patients by MRE and ileocolonoscopy, respectively, and who did not participate in any other interpretation of this study. The purpose of this study was to determine whether DWI could be used to longitudinally monitor imaging-detected inflammatory bowel lesions in CD; hence, we only considered those lesions that were clearly visible on pre-treatment DWI instead of broadly addressing DWI for general assessment of bowel inflammation in CD. We assessed the rate of follow-up failures using DWI in such a setting. A total of 40 index lesions including 14 terminal ileal and 26 colonic lesions measuring 2.1 to 8.5 cm (median, 3.8 cm) in length were initially identified. Of those, 3 lesions could not be followed (also see “Results” section) (Fig. 1).
Post-Treatment Examinations
Post-treatment examinations were identical to the pre-treatment examinations except that the gastroenterologists were informed of the index lesions and categorized the treatment response of index lesions as complete remission as well as reduced, unchanged or increased inflammation. The endoscopists were able to access the pre-treatment endoscopic video/images prior to post-treatment endoscopy to allow evaluation of the index lesions for interval change. Complete remission was defined as complete healing of pre-existing ulcers. Reduced inflammation was defined as decreased severity or extent of pre-existing lesions. Increased inflammation was defined as increased severity or extent of pre-existing lesions or the occurrence of new lesions.
DWI Analysis
Two board-certified abdominal radiologists (each with 1-year experience in MRE of CD patients) independently assessed the treatment responses of the index lesions by comparing the pre- and post-treatment DWI and ADC images. The readers did not participate in selecting the index lesions and were blinded to the reference standard information and therapeutic agents used. For anatomical reference, the readers could refer to coronal T2-weighted half-Fourier without fat suppression images, considering that the DWI and ADC images lack anatomical details, but were blinded to all other non-DWI MRE images. Each reader visually assessed the treatment response based on four categories: complete remission (complete resolution of abnormal mural diffusion restriction) and reduced (decreased intensity or extent of restricted mural diffusion), unchanged, or increased inflammation. Abnormal restricted diffusion was defined as a hyper-signal on DWI (b = 900 s/mm2) and hypo-signal on an ADC map comparable to lymph nodes, as adopted in published studies (7, 22). Subsequently, each reader measured the ADC of each index lesion using a dedicated image-processing software program based on the plug-in package for ImageJ (National Institutes of Health, Bethesda, MD, USA; http://rsbweb.nih.gov/ij/). A free-form ROI (mean ± SD, 46 ± 24 mm2) was carefully drawn to include each index lesion or the corresponding treated area after therapy, while avoiding contamination by adjacent structures on an image that showed the greatest extent of the lesion. Finally, the ΔADC value (pre-treatment ADC - post-treatment ADC) was obtained.
Reference Standards
Endoscopic findings were used as the reference standard for the four categorical treatment responses. The reference standard for quantitative evaluations of treatment responses using ΔADC was the difference (Δ) in the pre- and post-treatment CD MRI activity index (CDMI; scored from 0 to 12, higher values indicate more severe inflammation), based on validated conventional contrast-enhanced MRE (29,30). Further details of CDMI scoring system are explained elsewhere (29,30). The ΔCDMI for each index lesion was determined by an experienced radiologist who did not participate in any other study reviews and was blinded to the DWI, endoscopy, and other clinical findings.
Statistical Analysis
The proportion of index lesions that could not be assessed on the follow-up DWI was determined. The main study analyses were for those index lesions that could be evaluated successfully on the follow-up imaging. The ΔADC was compared between those lesions that improved (i.e., complete remission and reduced inflammation) and those that were unimproved (i.e., unchanged or increased inflammation) using the linear mixed model to account for a clustered data structure (i.e., several index lesions per patient). Diagnostic performance of the DWI for visual categorical treatment-response assessments was analyzed based on the diagnosis of improved inflammation (i.e., complete remission and reduced inflammation), complete remission, and the specific individual response categories using sensitivity, specificity, and accuracy parameters as appropriate. The performance of DWI for quantitatively assessing treatment responses was evaluated using a correlation analysis between ΔADC and ΔCDMI with the linear mixed model to adjust for the clustered data structure. Inter-reader agreement was evaluated for the categorical treatment-response assessments using a weighted kappa with adjustments for clustered data (31) and the overall proportional agreement; and was determined for the quantitative ΔADC measurements using an intra-class correlation coefficient (ICC) calculated with the linear mixed model (two-way random effects model including random intercepts for the patient and reader) to account for clustered data as well as the Bland-Altman analysis. SAS version 9.2 (SAS Institute, Cary, NC, USA) was used for analyses. p < 0.05 was considered statistically significant.
RESULTS
Subjects
Among the 40 index lesions initially identified, 2 lesions (1 each in the terminal ileum and sigmoid colon; 5% of 40 index lesions) could not be properly evaluated by post-treatment DWI due to luminal air-related artifacts on DWI. Another terminal ileal lesion could not be evaluated by follow-up colonoscopy because of ileocecal valve stricture that developed after treatment. Consequently, 37 lesions (1–4 lesions per patient; median, 2 lesions) were finally analyzed (Fig. 1). Further details of the lesions were provided in Table 1.
ADC Changes Throughout Treatment
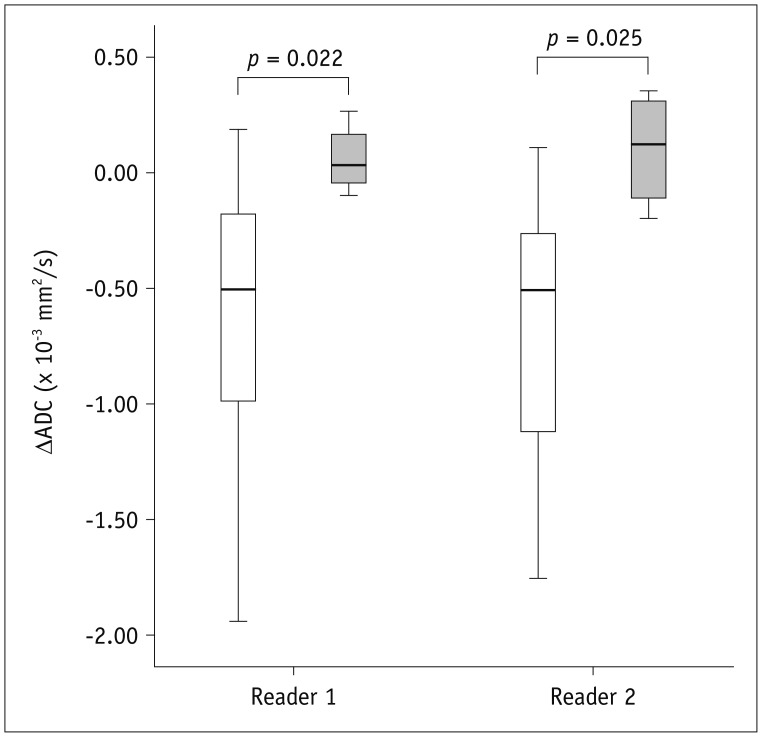
The ADC values of the 37 lesions (mean ± SD in × 10-3 mm2/s) were 1.48 ± 0.30 and 1.45 ± 0.32 according to the two readers before therapy and 2.06 ± 0.66 and 2.05 ± 0.64, respectively, at the post-treatment assessment. The ΔADC value was negative (i.e., ADC increased after treatment) in 31 of 33 (94%) improved lesions (i.e., complete remission and reduced inflammation) according to both readers (-1.94 × 10⁻³ to -0.04 × 10⁻³ mm2/s) but was positive in the remaining 2 (6%) improved lesions according to both readers (0.06 × 10⁻³ to 0.19 × 10⁻³ mm2/s) (Fig. 2). The ΔADC value was positive (i.e., ADC decreased after treatment) in either 2 or 3 of 4 unimproved lesions according to each reader (Fig. 2). The ΔADC value significantly differed between improved and unimproved lesions (Table 2, Fig. 2).
Fig. 2. Box plots comparing ΔADC between improved (white; left-side plot for each reader) and unimproved (gray; right-side plot for each reader) lesions according to reference standard after medical therapy.
ADC = apparent diffusion coefficient
Table 2. Comparisons of ΔADC (Pre-Treatment – Post-Treatment) between Improved and Unimproved Lesions According to Reference Standard, i.e., Endoscopy, after Therapy.
| Improved (n = 33)* | Unimproved (n = 4)* | P | |
|---|---|---|---|
| Reader 1 | -0.65 ± 0.58 | 0.06 ± 0.15 | 0.022 |
| Reader 2 | -0.68 ± 0.56 | 0.10 ± 0.26 | 0.025 |
Data are mean ± SD in × 10-3 mm2/s. *Improved lesions include complete remission or reduced inflammation. Unimproved lesions include unchanged or increased inflammation. ADC = apparent diffusion coefficient
Visual Categorical Treatment-Response Assessment
Overall, the performance of DWI for diagnosing improved inflammation (i.e., complete remission and reduced inflammation) and complete remission was moderate (accuracy of 76% [28/37] to 84% [31/37]) (Table 3) despite the small number of unimproved lesions (4 lesions). The accuracy of DWI for diagnosing the four specific treatment-response categories was relatively low (Table 3). Example cases were shown in Figures 3, 4, 5.
Table 3. DWI Performance for Categorical Treatment-Response Assessment.
| Sensitivity | Specificity | Accuracy | |
|---|---|---|---|
| Diagnosis of improved inflammation* | |||
| Reader 1 | 88% (29/33) | 25% (1/4) | 81% (30/37) |
| Reader 2 | 85% (28/33) | 75% (3/4) | 84% (31/37) |
| Diagnosis of complete remission | |||
| Reader 1 | 79% (11/14) | 74% (17/23) | 76% (28/37) |
| Reader 2 | 86% (12/14) | 78% (18/23) | 81% (30/37) |
| Diagnosis of specific response category | |||
| Reader 1 | NA | NA | 54% (20/37) |
| Reader 2 | NA | NA | 65% (24/37) |
Numbers in parentheses indicate number of index lesions.
*Includes complete remission and reduced inflammation. DWI = diffusion-weighted imaging, NA = not applicable
Fig. 3. 20-year-old man (at diagnosis) with CD who showed complete remission of terminal ileal lesion on endoscopy after 2 years of therapy.
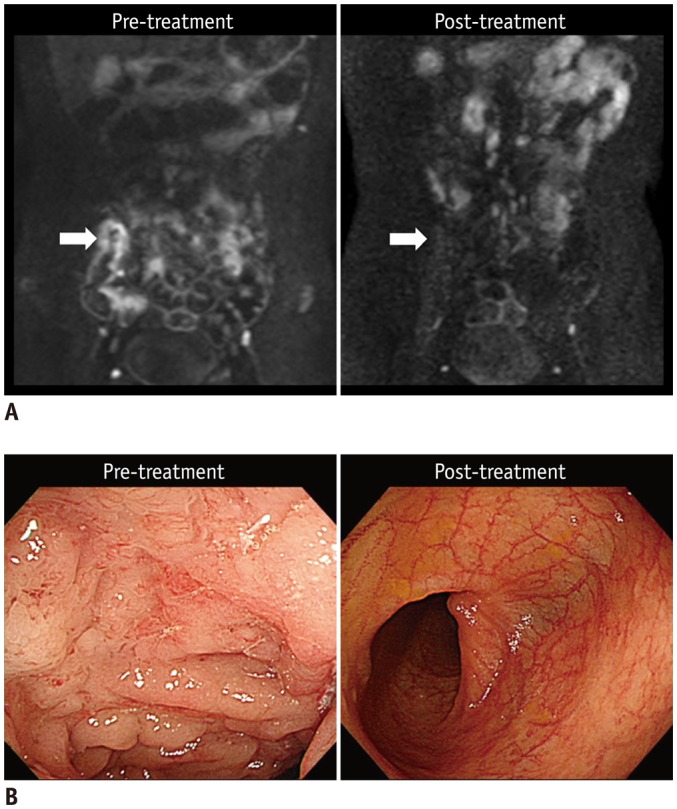
A. Pre- and post-treatment DWI images (b = 900 s/mm2) indicate that restricted diffusion, which appears as hyperintensity in terminal ileum before treatment (left arrow), had completely disappeared at time of complete remission after treatment (right arrow). B. Colonoscopic images of terminal ileum shows complete resolution of multiple ulcers and mucosal swelling after treatment. CD = Crohn's disease, DWI = diffusion-weighted imaging
Fig. 4. 21-year-old man (at diagnosis) with CD shows reduced inflammation in descending colon on endoscopy after 1 year of therapy.
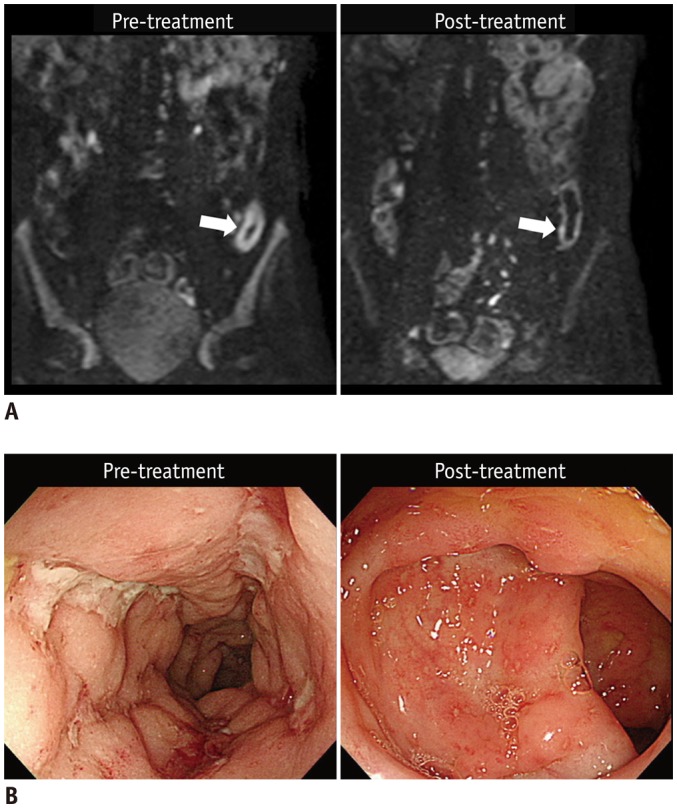
A. Pre- and post-treatment DWI images (b = 900 s/mm2) show that restricted diffusion, which appears as hyperintensity in distal descending colon, before treatment (left arrow) was remarkably reduced after treatment (right arrow). B. Colonoscopic images of corresponding area show large deep longitudinal ulcers before treatment (left), and reduced inflammation after treatment, presented as scattered small superficial ulcers and aphthoid lesions (right). CD = Crohn's disease, DWI = diffusion-weighted imaging
Fig. 5. 25-year-old man (at diagnosis) with CD who showed unchanged inflammation in descending colon on endoscopy after 2 years of therapy.
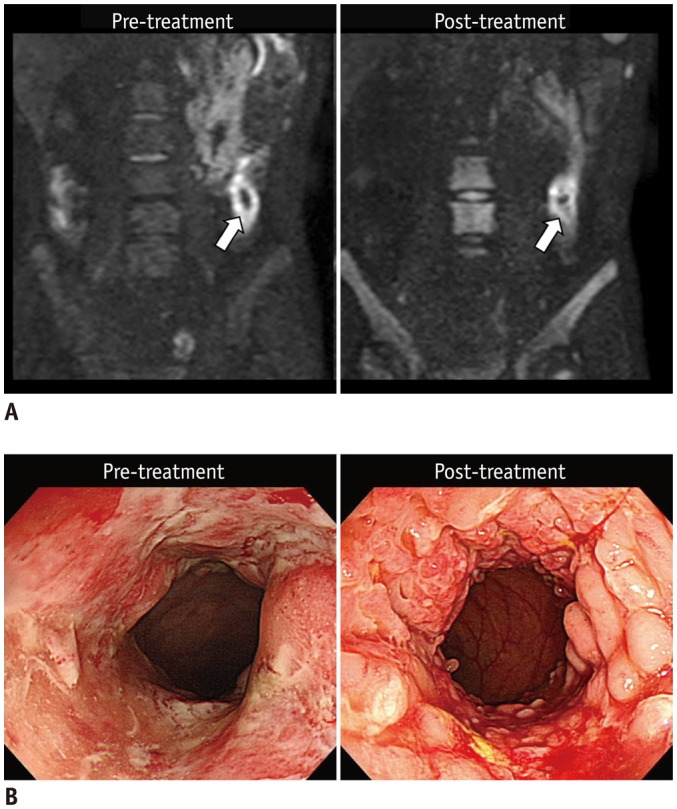
A. Pre- and post-treatment DWI images (b = 900 s/mm2) reveal similar restricted diffusion that appears as hyperintensity in descending colon (arrows). B. Colonoscopic images of corresponding area reveal persistent extensive inflammation with multiple large ulcers before treatment and on follow-up without remarkable improvement. CD = Crohn's disease, DWI = diffusion-weighted imaging
Quantitative Treatment-Response Assessment
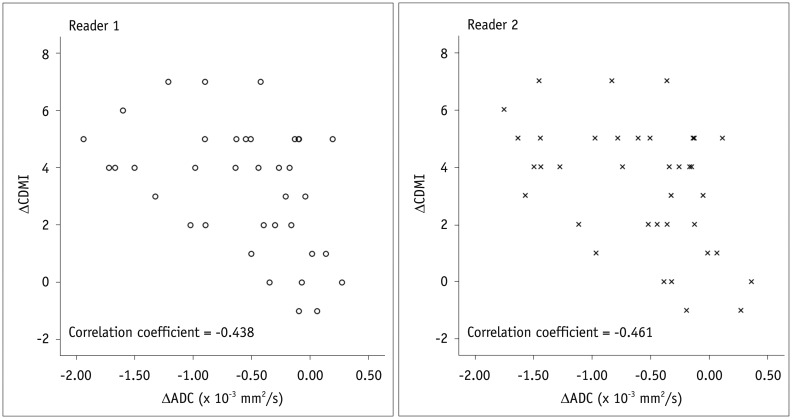
For both readers, there was a significant negative correlation between the ΔADC and ΔCDMI with respective correlation coefficients adjusted for data clustering of -0.438 and -0.461 for the two readers (p < 0.05) (Fig. 6). This result indicated linear changes in bowel inflammatory severities after treatment based on changes in mural ADC.
Fig. 6. Scatter plots show negative correlation between ΔADC and ΔCDMI (reference standard).
CDMI = Crohn's disease MRI activity index
Inter-Reader Agreement
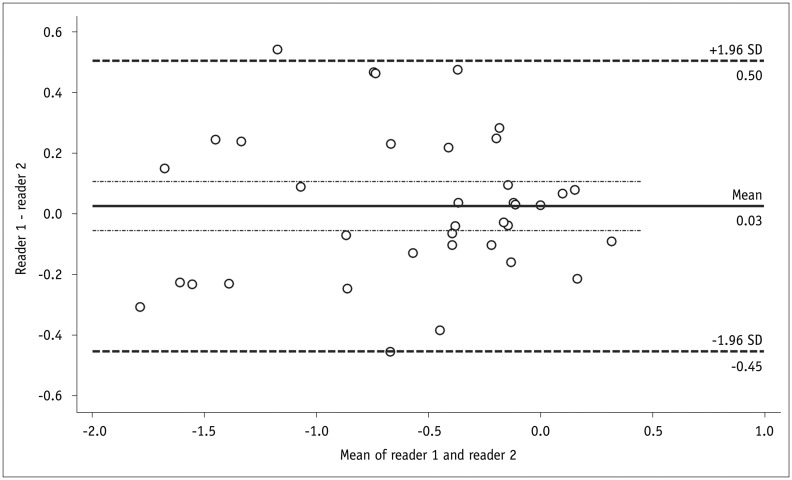
The kappa value for inter-reader agreement in categorical treatment-response assessments was 0.519 (95% confidence interval [CI], 0.335–0.703). The two readers completely agreed in 22 segments (59.5%) and differed by 1 category in 15 segments (40.5%) (Table 4), with no disagreement by ≥ 2 categories. The ICC for inter-reader agreement in quantitative measurements of ΔADC was 0.918 (95% CI, 0.730–0.979). The mean difference in ΔADC between the two readers (reader 1 - reader 2) was 0.03 × 10⁻³ mm2/s and the Bland-Altman coefficient of repeatability was 0.47 × 10⁻³ mm2/s (Fig. 7).
Table 4. Inter-Reader Agreement for Categorical Treatment-Response Assessment using DWI.
| DWI Interpretation by Reader 2 | DWI Interpretation by Reader 1 | Total | |||
|---|---|---|---|---|---|
| Complete Remission | Reduced Inflammation | Unchanged Inflammation | Increased Inflammation | ||
| Complete remission | 14 | 3 | 0 | 0 | 17 |
| Reduced inflammation | 3 | 7 | 2 | 0 | 12 |
| Unchanged inflammation | 0 | 5 | 1 | 1 | 7 |
| Increased inflammation | 0 | 0 | 1 | 0 | 1 |
| Total | 17 | 15 | 4 | 1 | 37 |
Data indicate number of index lesions. DWI = diffusion-weighted imaging
Fig. 7. Bland-Altman plot shows inter-reader agreement in ΔADC (× 10-3 mm2/s).
ADC = apparent diffusion coefficient
DISCUSSION
Results from this prospective longitudinal study indicated that DWI may be a feasible tool for monitoring bowel inflammation after medical therapy in patients with CD, since ADC changed in a linear manner according to changes in bowel inflammation after treatment. A small fraction of the index lesions (5%) could not be evaluated on the follow-up DWI due to artifacts, even though we initially included those lesions unaffected by artifacts on the first MRE, suggestive of risk of follow-up failures using DWI. In general, DWI has less technical stability as compared with other general MRE sequences. As this study was not designed to primarily evaluate technical stability of DWI MRE, this issue needs to be addressed in future studies. Our results also directly confirmed that bowel inflammation in CD is a cause of mural diffusion restriction on DWI, while not designed to specifically determine the association between bowel fibrosis and diffusion restriction in CD.
For ADC to be a reliable biomarker of treatment response in CD patients, the following criteria should be satisfied: 1) ADC should correlate with the severity of bowel inflammation; 2) ADC changes between before and after treatment should correlate with changes in the severity of bowel inflammation during a course of therapy; and 3) ADC measurements in the bowel wall should be reproducible.
The first criterion was confirmed by previous cross-sectional single-time observational studies (7,8,9,10,11,12,13,14). The second criterion can only be evaluated by longitudinal studies and, hence, is supported to a certain extent by the moderate correlation strength provided by ΔADC (i.e., -0.438 and -0.461) in our study. The reproducibility (or variability) of ADC measurements in the bowel of CD patients remains to be determined (2,32) in future studies. Collective results from the present and previous studies (10,14) indicate that fairly high inter-observer agreement can be achieved to measure changes in ADC values from the bowel wall in CD patients (i.e., ICC of 0.918 without remarkable systematic bias between the two readers) for a given dataset. However, reproducibility of ADC measurements extends beyond observer agreement for a given set of images (32). The absolute ADC values may change without any real changes in a tissue as a consequence of different scanning techniques and parameters, inter-scanner variability, and within scanner variability. Variability in ADC values has been reported in various other abdominal applications (33,34,35,36,37,38). For example, ADC values measured in malignant hepatic tumors changed as much as 30% of the original value because of scan-rescan variability (35). Therefore, similar variability may exist for measurements of ADC in the bowel and a correct interpretation of ΔADC should account for such variability. Positive ΔADC values (i.e., ADC decrease after treatment) in a small number of lesions despite improved inflammation (2 of 33 lesions) and negative ΔADC values (i.e., ADC increase after treatment) and no improvement in inflammation in a few other lesions likely reflect variability in the ADC measurements.
In daily clinical practice, radiologists generally prefer visual assessments of DWI and ADC images over quantitative measurements of ADC values because the former is more practical and consistent, though less refined. Our current study demonstrated that visual assessments are feasible for clinical assessment of treatment responses in CD patients with moderate accuracy in diagnosis of improvement or complete remission of bowel inflammation and fairly high inter-reader agreement (the moderate face kappa value was partly due to the prevalence effect (39) caused by skewed distribution of subjects towards complete remission and reduced inflammation).
This study had limitations. First, the modest number of patients. However, we evaluated several index lesions from each patient while accounting for statistical correlations between lesions clustered in each patient. Thus, the results of data analysis fairly clearly confirmed that DWI could monitor post-therapeutic quantitative and qualitative changes in bowel inflammation. An unresolved weakness of our study was the inclusion of only 4 lesions that did not improve across treatment. A larger number of such cases would enable more robust conclusions. Given that medical treatments aimed at complete mucosal healing are increasingly accepted as the standard treatment for CD (3,4,5,6), stable or aggravated bowel inflammation after therapy is now becoming rarer, in contrast with past CD management that primarily focused on symptomatic control. Additionally, although this study included patients who received an array of different treatments as seen in typical clinical practice, the small sample prevented evaluation of any potential differences between different therapeutic agents. Second, due to small sample size, the reader reproducibility might have been somewhat overestimated. It would be worthwhile to assess whether the same consistency between readers could be achieved in actual clinical practice.
In conclusion, mural diffusion restriction improves along with increases in ADC, as endoscopic bowel inflammation in patients with CD decreases after medical therapy. DWI may represent a feasible tool for monitoring bowel inflammation in patients with CD, both quantitatively using ADC and qualitatively using visual evaluations after medical treatment. However, further assessments of its reproducibility are required prior to widespread clinical use.
Acknowledgments
Authors appreciate technical support by Yu Sub Sung, PhD at the Biomedical Imaging Infrastructure in the Department of Radiology, Asan Medical Center.
Footnotes
This work was supported by a grant from Dongkook Pharmaceutical, Seoul, South Korea. The funder had no role in the study design, in the data collection, analysis or interpretation, in the writing of the manuscript or in the decision to submit the manuscript for publication. The corresponding author had full access to all of the study data and had final responsibility for deciding to submit the paper for publication.
Supplementary Materials
The online-only Data Supplement is available with this article at https://doi.org/10.3348/kjr.2017.18.1.162.
MRE Scan Parameters
References
- 1.Choi SH, Kim KW, Lee JY, Kim KJ, Park SH. Diffusion-weighted magnetic resonance enterography for evaluating bowel inflammation in Crohn's disease: a systematic review and meta-analysis. Inflamm Bowel Dis. 2016;22:669–679. doi: 10.1097/MIB.0000000000000607. [DOI] [PubMed] [Google Scholar]
- 2.Park SH. DWI at MR enterography for evaluating bowel inflammation in Crohn disease. AJR Am J Roentgenol. 2016;207:40–48. doi: 10.2214/AJR.15.15862. [DOI] [PubMed] [Google Scholar]
- 3.Cheifetz AS. Management of active Crohn disease. JAMA. 2013;309:2150–2158. doi: 10.1001/jama.2013.4466. [DOI] [PMC free article] [PubMed] [Google Scholar]
- 4.Lichtenstein GR, Hanauer SB, Sandborn WJ Practice Parameters Committee of American College of Gastroenterology. Management of Crohn's disease in adults. Am J Gastroenterol. 2009;104:465–483. doi: 10.1038/ajg.2008.168. quiz 464, 484. [DOI] [PubMed] [Google Scholar]
- 5.Ordás I, Feagan BG, Sandborn WJ. Early use of immunosuppressives or TNF antagonists for the treatment of Crohn's disease: time for a change. Gut. 2011;60:1754–1763. doi: 10.1136/gutjnl-2011-300934. [DOI] [PubMed] [Google Scholar]
- 6.Sadowski DC, Bernstein CN, Bitton A, Croitoru K, Fedorak RN, Griffiths A CAG Crohn's Consensus Group. Canadian Association of Gastroenterology Clinical Practice Guidelines: the use of tumour necrosis factor-alpha antagonist therapy in Crohn's disease. Can J Gastroenterol. 2009;23:185–202. doi: 10.1155/2009/201430. [DOI] [PMC free article] [PubMed] [Google Scholar]
- 7.Seo N, Park SH, Kim KJ, Kang BK, Lee Y, Yang SK, et al. MR enterography for the evaluation of small-bowel inflammation in Crohn disease by using diffusion-weighted imaging without intravenous contrast material: a prospective noninferiority study. Radiology. 2016;278:762–772. doi: 10.1148/radiol.2015150809. [DOI] [PubMed] [Google Scholar]
- 8.Buisson A, Hordonneau C, Goutte M, Boyer L, Pereira B, Bommelaer G. Diffusion-weighted magnetic resonance imaging is effective to detect ileocolonic ulcerations in Crohn's disease. Aliment Pharmacol Ther. 2015;42:452–460. doi: 10.1111/apt.13287. [DOI] [PubMed] [Google Scholar]
- 9.Tielbeek JA, Ziech ML, Li Z, Lavini C, Bipat S, Bemelman WA, et al. Evaluation of conventional, dynamic contrast enhanced and diffusion weighted MRI for quantitative Crohn's disease assessment with histopathology of surgical specimens. Eur Radiol. 2014;24:619–629. doi: 10.1007/s00330-013-3015-7. [DOI] [PubMed] [Google Scholar]
- 10.Hordonneau C, Buisson A, Scanzi J, Goutorbe F, Pereira B, Borderon C, et al. Diffusion-weighted magnetic resonance imaging in ileocolonic Crohn's disease: validation of quantitative index of activity. Am J Gastroenterol. 2014;109:89–98. doi: 10.1038/ajg.2013.385. [DOI] [PubMed] [Google Scholar]
- 11.Caruso A, D'Incà R, Scarpa M, Manfrin P, Rudatis M, Pozza A, et al. Diffusion-weighted magnetic resonance for assessing ileal Crohn's disease activity. Inflamm Bowel Dis. 2014;20:1575–1583. doi: 10.1097/MIB.0000000000000128. [DOI] [PubMed] [Google Scholar]
- 12.Ream JM, Dillman JR, Adler J, Khalatbari S, McHugh JB, Strouse PJ, et al. MRI diffusion-weighted imaging (DWI) in pediatric small bowel Crohn disease: correlation with MRI findings of active bowel wall inflammation. Pediatr Radiol. 2013;43:1077–1085. doi: 10.1007/s00247-013-2712-3. [DOI] [PubMed] [Google Scholar]
- 13.Neubauer H, Pabst T, Dick A, Machann W, Evangelista L, Wirth C, et al. Small-bowel MRI in children and young adults with Crohn disease: retrospective head-to-head comparison of contrast-enhanced and diffusion-weighted MRI. Pediatr Radiol. 2013;43:103–114. doi: 10.1007/s00247-012-2492-1. [DOI] [PubMed] [Google Scholar]
- 14.Buisson A, Joubert A, Montoriol PF, Da Ines D, Hordonneau C, Pereira B, et al. Diffusion-weighted magnetic resonance imaging for detecting and assessing ileal inflammation in Crohn's disease. Aliment Pharmacol Ther. 2013;37:537–545. doi: 10.1111/apt.12201. [DOI] [PubMed] [Google Scholar]
- 15.Bhatnagar G, Dikaios N, Prezzi D, Vega R, Halligan S, Taylor SA. Changes in dynamic contrast-enhanced pharmacokinetic and diffusion-weighted imaging parameters reflect response to anti-TNF therapy in Crohn's disease. Br J Radiol. 2015;88:20150547. doi: 10.1259/bjr.20150547. [DOI] [PMC free article] [PubMed] [Google Scholar]
- 16.Baars JE, Nuij VJ, Oldenburg B, Kuipers EJ, van der Woude CJ. Majority of patients with inflammatory bowel disease in clinical remission have mucosal inflammation. Inflamm Bowel Dis. 2012;18:1634–1640. doi: 10.1002/ibd.21925. [DOI] [PubMed] [Google Scholar]
- 17.Peyrin-Biroulet L, Reinisch W, Colombel JF, Mantzaris GJ, Kornbluth A, Diamond R, et al. Clinical disease activity, C-reactive protein normalisation and mucosal healing in Crohn's disease in the SONIC trial. Gut. 2014;63:88–95. doi: 10.1136/gutjnl-2013-304984. [DOI] [PubMed] [Google Scholar]
- 18.Catalano OA, Gee MS, Nicolai E, Selvaggi F, Pellino G, Cuocolo A, et al. Evaluation of quantitative PET/MR enterography biomarkers for discrimination of inflammatory strictures from fibrotic strictures in Crohn disease. Radiology. 2016;278:792–800. doi: 10.1148/radiol.2015150566. [DOI] [PubMed] [Google Scholar]
- 19.Kovanlikaya A, Beneck D, Rose M, Renjen P, Dunning A, Solomon A, et al. Quantitative apparent diffusion coefficient (ADC) values as an imaging biomarker for fibrosis in pediatric Crohn's disease: preliminary experience. Abdom Imaging. 2015;40:1068–1074. doi: 10.1007/s00261-014-0247-1. [DOI] [PubMed] [Google Scholar]
- 20.Adler J, Punglia DR, Dillman JR, Polydorides AD, Dave M, Al-Hawary MM, et al. Computed tomography enterography findings correlate with tissue inflammation, not fibrosis in resected small bowel Crohn's disease. Inflamm Bowel Dis. 2012;18:849–856. doi: 10.1002/ibd.21801. [DOI] [PubMed] [Google Scholar]
- 21.Zappa M, Stefanescu C, Cazals-Hatem D, Bretagnol F, Deschamps L, Attar A, et al. Which magnetic resonance imaging findings accurately evaluate inflammation in small bowel Crohn's disease? A retrospective comparison with surgical pathologic analysis. Inflamm Bowel Dis. 2011;17:984–993. doi: 10.1002/ibd.21414. [DOI] [PubMed] [Google Scholar]
- 22.Kim KJ, Lee Y, Park SH, Kang BK, Seo N, Yang SK, et al. Diffusion-weighted MR enterography for evaluating Crohn's disease: how does it add diagnostically to conventional MR enterography? Inflamm Bowel Dis. 2015;21:101–109. doi: 10.1097/MIB.0000000000000222. [DOI] [PubMed] [Google Scholar]
- 23.Lennard-Jones JE. Classification of inflammatory bowel disease. Scand J Gastroenterol Suppl. 1989;170:2–6. doi: 10.3109/00365528909091339. discussion 16-19. [DOI] [PubMed] [Google Scholar]
- 24.Van Assche G, Dignass A, Panes J, Beaugerie L, Karagiannis J, Allez M, et al. The second european evidence-based consensus on the diagnosis and management of Crohn's disease: definitions and diagnosis. J Crohns Colitis. 2010;4:7–27. doi: 10.1016/j.crohns.2009.12.003. [DOI] [PubMed] [Google Scholar]
- 25.Colombel JF, Rutgeerts PJ, Sandborn WJ, Yang M, Camez A, Pollack PF, et al. Adalimumab induces deep remission in patients with Crohn's disease. Clin Gastroenterol Hepatol. 2014;12:414–422.e5. doi: 10.1016/j.cgh.2013.06.019. [DOI] [PubMed] [Google Scholar]
- 26.Colombel JF, Sandborn WJ, Reinisch W, Mantzaris GJ, Kornbluth A, Rachmilewitz D, et al. Infliximab, azathioprine, or combination therapy for Crohn's disease. N Engl J Med. 2010;362:1383–1395. doi: 10.1056/NEJMoa0904492. [DOI] [PubMed] [Google Scholar]
- 27.Rutgeerts P, Van Assche G, Sandborn WJ, Wolf DC, Geboes K, Colombel JF, et al. Adalimumab induces and maintains mucosal healing in patients with Crohn's disease: data from the EXTEND trial. Gastroenterology. 2012;142:1102–1111.e2. doi: 10.1053/j.gastro.2012.01.035. [DOI] [PubMed] [Google Scholar]
- 28.Mary JY, Modigliani R Groupe d'Etudes Thérapeutiques des Affections Inflammatoires du Tube Digestif (GETAID) Development and validation of an endoscopic index of the severity for Crohn's disease: a prospective multicentre study. Gut. 1989;30:983–989. doi: 10.1136/gut.30.7.983. [DOI] [PMC free article] [PubMed] [Google Scholar]
- 29.Steward MJ, Punwani S, Proctor I, Adjei-Gyamfi Y, Chatterjee F, Bloom S, et al. Non-perforating small bowel Crohn's disease assessed by MRI enterography: derivation and histopathological validation of an MR-based activity index. Eur J Radiol. 2012;81:2080–2088. doi: 10.1016/j.ejrad.2011.07.013. [DOI] [PubMed] [Google Scholar]
- 30.Tielbeek JA, Makanyanga JC, Bipat S, Pendsé DA, Nio CY, Vos FM, et al. Grading Crohn disease activity with MRI: interobserver variability of MRI features, MRI scoring of severity, and correlation with Crohn disease endoscopic index of severity. AJR Am J Roentgenol. 2013;201:1220–1228. doi: 10.2214/AJR.12.10341. [DOI] [PubMed] [Google Scholar]
- 31.Yang Z, Zhou M. Weighted kappa statistic for clustered matched-pair ordinal data. Comput Stat Data Anal. 2015;82:1–18. [Google Scholar]
- 32.Kim SY, Park SH. Reply to what is the role of diffusion-weighted imaging in ileocolonic Crohn's disease? Inflamm Bowel Dis. 2015;21:E9–E10. doi: 10.1097/MIB.0000000000000414. [DOI] [PMC free article] [PubMed] [Google Scholar]
- 33.Bilgili MY. Reproductibility of apparent diffusion coefficients measurements in diffusion-weighted MRI of the abdomen with different b values. Eur J Radiol. 2012;81:2066–2068. doi: 10.1016/j.ejrad.2011.06.045. [DOI] [PubMed] [Google Scholar]
- 34.Braithwaite AC, Dale BM, Boll DT, Merkle EM. Short- and midterm reproducibility of apparent diffusion coefficient measurements at 3.0-T diffusion-weighted imaging of the abdomen. Radiology. 2009;250:459–465. doi: 10.1148/radiol.2502080849. [DOI] [PubMed] [Google Scholar]
- 35.Kim SY, Lee SS, Byun JH, Park SH, Kim JK, Park B, et al. Malignant hepatic tumors: short-term reproducibility of apparent diffusion coefficients with breath-hold and respiratory-triggered diffusion-weighted MR imaging. Radiology. 2010;255:815–823. doi: 10.1148/radiol.10091706. [DOI] [PubMed] [Google Scholar]
- 36.Kim SY, Lee SS, Park B, Kim N, Kim JK, Park SH, et al. Reproducibility of measurement of apparent diffusion coefficients of malignant hepatic tumors: effect of DWI techniques and calculation methods. J Magn Reson Imaging. 2012;36:1131–1138. doi: 10.1002/jmri.23744. [DOI] [PubMed] [Google Scholar]
- 37.Miquel ME, Scott AD, Macdougall ND, Boubertakh R, Bharwani N, Rockall AG. In vitro and in vivo repeatability of abdominal diffusion-weighted MRI. Br J Radiol. 2012;85:1507–1512. doi: 10.1259/bjr/32269440. [DOI] [PMC free article] [PubMed] [Google Scholar]
- 38.Taouli B, Koh DM. Diffusion-weighted MR imaging of the liver. Radiology. 2010;254:47–66. doi: 10.1148/radiol.09090021. [DOI] [PubMed] [Google Scholar]
- 39.Feinstein AR, Cicchetti DV. High agreement but low kappa: I. The problems of two paradoxes. J Clin Epidemiol. 1990;43:543–549. doi: 10.1016/0895-4356(90)90158-l. [DOI] [PubMed] [Google Scholar]
Associated Data
This section collects any data citations, data availability statements, or supplementary materials included in this article.
Supplementary Materials
MRE Scan Parameters


