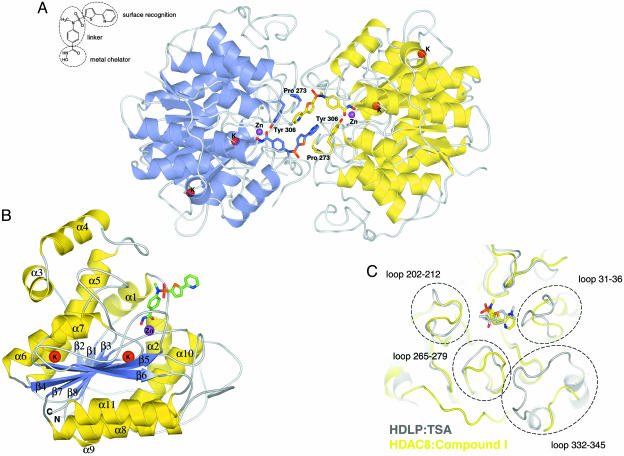
Fig. 2.
Overall HDAC8 structure. (A) Ribbon diagram of the asymmetric unit of human HDAC8 crystals. The two monomers, A and B, are shown in indigo and yellow, respectively. The two inhibitor molecules and residues involved in the head-to-head packing are drawn in stick representation. Red, oxygen; blue, nitrogen; orange, sulfur. Carbon is shown in indigo (molecule A) and yellow (molecule B). Violet spheres, Zn2+ ions; red spheres, K+ ions. The chemical structure of the hydroxamic acid inhibitor is drawn in the upper left. (B) Ribbon diagram of human HDAC8 monomer with α-helices and β-strands labeled and colored yellow and indigo, respectively. The inhibitor is drawn in stick representation. Red, oxygen; blue, nitrogen; orange, sulfur; green, carbon. (C) Superposition of human HDAC8 (yellow) and HDLP (gray) backbone. Compound 1 and TSA are drawn in stick representation. Oxygen, nitrogen, and sulfur are colored as in A. Carbon is shown in yellow (compound 1) and gray (TSA). Dashed circles highlight structural variations of loops emerging from the core of the two structures.

