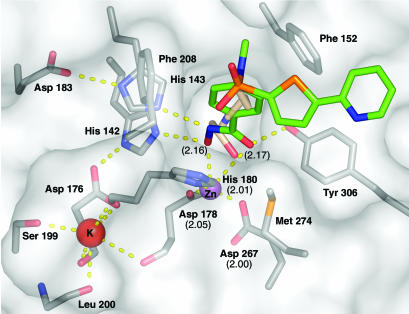
Fig. 3.
Molecular surface representation and architecture of HDAC8 active site. Residues relevant for catalysis and involved in inhibitor binding as well as the inhibitor and the modeled acetyllysine are drawn in stick representation. Red, oxygen; blue, nitrogen; orange, sulfur; gray, carbon. Carbon is colored green for the inhibitor and wheat for the docked acetyllysine. Polar interactions are shown as dashed yellow lines. Numbers in parentheses represent the zinc-ligand distances.

