Figure 3.

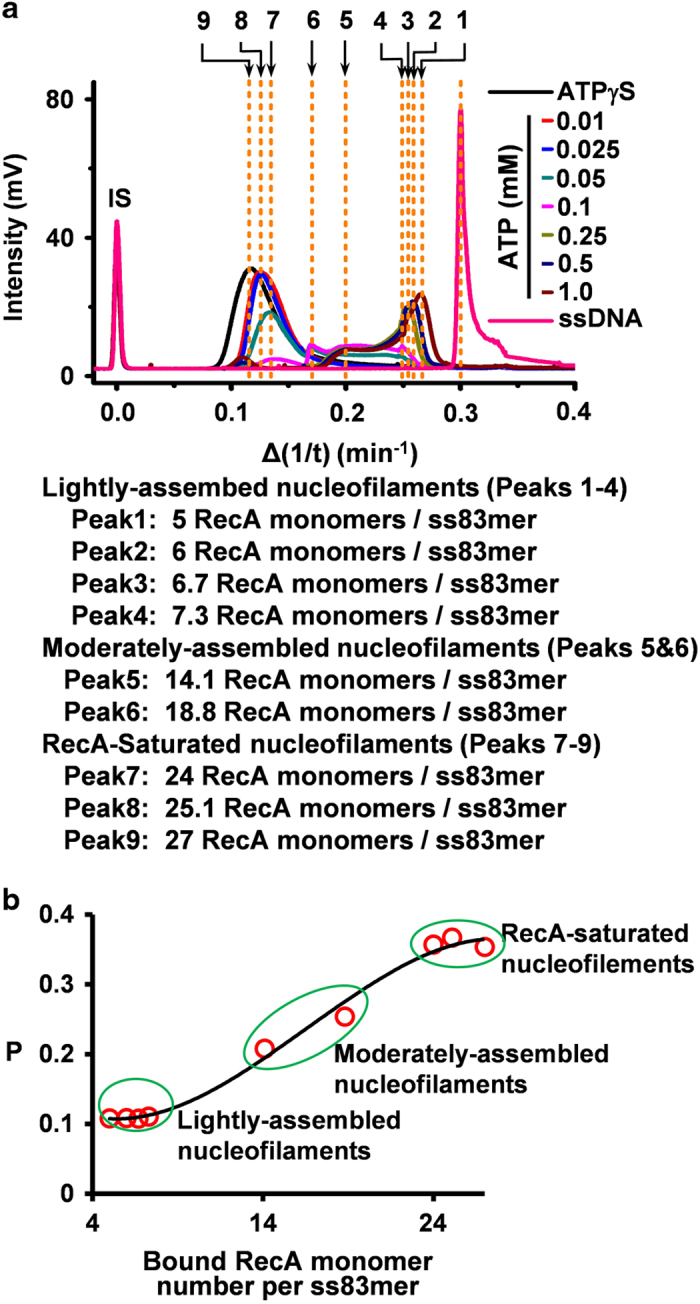
Quantitation of the binding stoichiometry of dynamic RecA nucleofilaments. (a) Overlay of the CE-LIFP electropherograms obtained by varying ATP concentration (0.01–1.0 mM) versus Δ(1/t) and the estimated binding number of RecA in each nucleofilament. The RecA-saturated nucleofilaments stimulated by ATPγS and unbound TMR-ss83mer were used to indicate the binding of 27 and 0 RecA monomers to one TMR-ss83mer molecule, respectively. The top numbers (1–9) are ranked in the order of Δ(1/t) for all the peaks of RecA-TMR-ss83mer filaments obtained by the use of ATP at indicated concentrations (0.01–1.0 mM). The binding numbers were estimated using the equation listed in Supplementary Figure S7 and the obtained binding numbers are shown right below the overlapped figures. (b) The correlation of the measured polarization values (P) of each RecA-TMR-ss83mer filaments with the binding number of RecA monomer per ss83mer (b).
