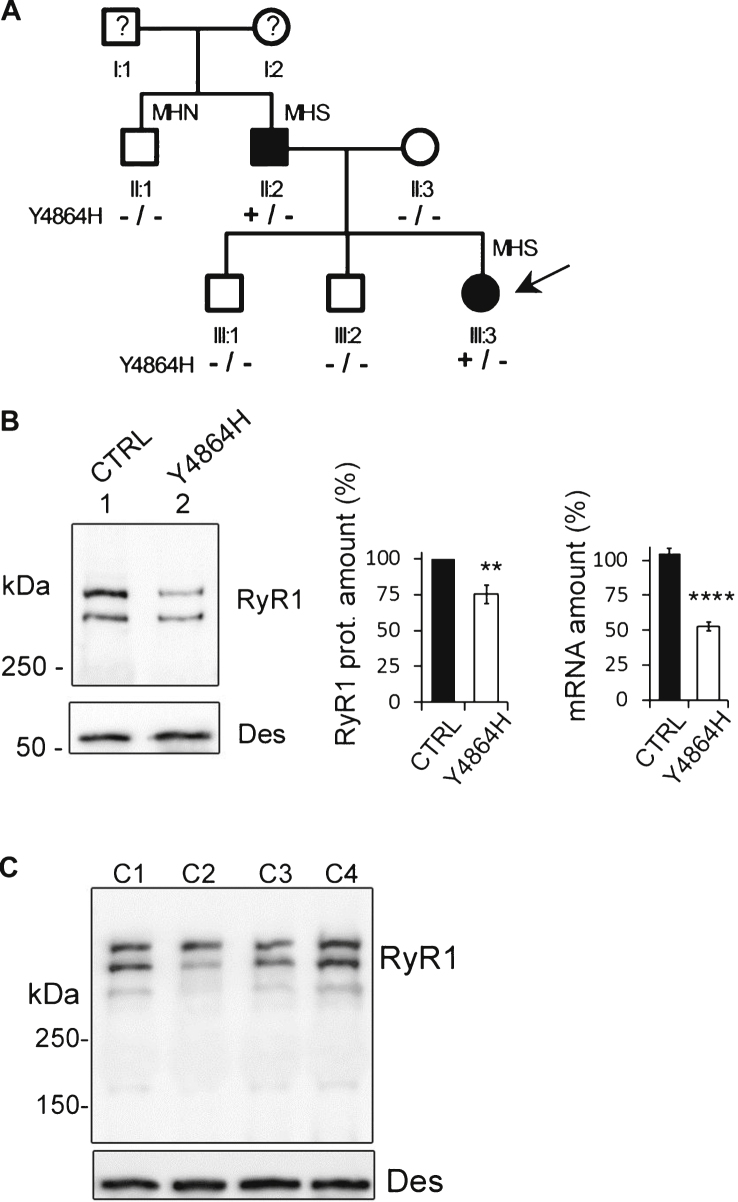
Fig.1.
Case description. (A). Pedigree of the family. Circles represent females and squares males. Filled symbols indicate affected individuals. The proband is indicated by the black arrow. Segregation of alleles is indicated below each individual. MH = Malignant Hyperthermia; MHN = MH Negative; MHS = MH Susceptible. (B). Quantitative analysis of RyR1 expression (protein and mRNA) in the skeletal muscle of the proband (Individual III.3). Twenty μg muscle homogenate from control (CTRL, lane 1) or proband (Y4864H, lane 2) were loaded on a 4–15% polyacrylamide gel. The amount of RyR1 protein is expressed as the percentage of RyR1 present in the control muscle, which relative expression compared to myosin was set at 100% . The central bars graph presents RyR1 protein mean amount ± SEM from seven different Western blots. The bar graph on the right is the Q-RT-PCR analysis of levels of RyR1 mRNA expressed as a percentage of control (which relative expression compared to reference genes was set to 100%). The data are presented as mean ± SEM of 9–12 different amplifications. **p < 0.01, ****p < 0.0001, Student’s t-test. (C) Representative Western blot of different controls (C1-C4), non-affected women between 20 and 23 years.

